Immigrants from Western Asia vs Immigrants from Caribbean 5th Grade

COMPARE

Immigrants from Western Asia
Race
Ancestry
AfghanAfricanAlaska NativeAlaskan AthabascanAlbanianAleutAlsatianAmericanApacheArabArapahoArgentineanArmenianAssyrian/Chaldean/SyriacAustralianAustrianBahamianBangladeshiBarbadianBasqueBelgianBelizeanBermudanBhutaneseBlackfeetBolivianBrazilianBritishBritish West IndianBulgarianBurmeseCajunCambodianCanadianCape VerdeanCarpatho RusynCelticCentral AmericanCentral American IndianCherokeeCheyenneChickasawChileanChineseChippewaChoctawColombianColvilleComancheCosta RicanCreeCreekCroatianCrowCubanCypriotCzechCzechoslovakianDanishDelawareDominicanDutchDutch West IndianEastern EuropeanEcuadorianEgyptianEnglishEstonianEthiopianEuropeanFijianFilipinoFinnishFrenchFrench American IndianFrench CanadianGermanGerman RussianGhanaianGreekGuamanian/ChamorroGuatemalanGuyaneseHaitianHmongHonduranHopiHoumaHungarianIcelanderIndian (Asian)IndonesianInupiatIranianIraqiIrishIroquoisIsraeliItalianJamaicanJapaneseJordanianKenyanKiowaKoreanLaotianLatvianLebaneseLiberianLithuanianLumbeeLuxembourgerMacedonianMalaysianMalteseMarshalleseMenomineeMexicanMexican American IndianMongolianMoroccanNative HawaiianNavajoNepaleseNew ZealanderNicaraguanNigerianNorthern EuropeanNorwegianOkinawanOsageOttawaPaiutePakistaniPalestinianPanamanianParaguayanPennsylvania GermanPeruvianPimaPolishPortuguesePotawatomiPuebloPuerto RicanPuget Sound SalishRomanianRussianSalvadoranSamoanScandinavianScotch-IrishScottishSeminoleSenegaleseSerbianShoshoneSierra LeoneanSiouxSlavicSlovakSloveneSomaliSouth AfricanSouth AmericanSouth American IndianSoviet UnionSpaniardSpanishSpanish AmericanSpanish American IndianSri LankanSubsaharan AfricanSudaneseSwedishSwissSyrianTaiwaneseThaiTlingit-HaidaTohono O'OdhamTonganTrinidadian and TobagonianTsimshianTurkishU.S. Virgin IslanderUgandanUkrainianUruguayanUteVenezuelanVietnameseWelshWest IndianYakamaYaquiYugoslavianYumanYup'ikZimbabwean
Immigration
NonimmigrantsImmigrantsAfghanistanAfricaAlbaniaArgentinaArmeniaAsiaAustraliaAustriaBahamasBangladeshBarbadosBelarusBelgiumBelizeBoliviaBosnia and HerzegovinaBrazilBulgariaBurma/MyanmarCabo VerdeCambodiaCameroonCanadaCentral AmericaChileChinaColombiaCongoCosta RicaCroatiaCubaCzechoslovakiaDenmarkDominicaDominican RepublicEastern AfricaEastern AsiaEastern EuropeEcuadorEgyptEl SalvadorEnglandEritreaEthiopiaEuropeFijiFranceGermanyGhanaGreeceGrenadaGuatemalaGuyanaHaitiHondurasHong KongHungaryIndiaIndonesiaIranIraqIrelandIsraelItalyJamaicaJapanJordanKazakhstanKenyaKoreaKuwaitLaosLatin AmericaLatviaLebanonLiberiaLithuaniaMalaysiaMexicoMicronesiaMiddle AfricaMoldovaMoroccoNepalNetherlandsNicaraguaNigeriaNorth AmericaNorth MacedoniaNorthern AfricaNorthern EuropeNorwayOceaniaPakistanPanamaPeruPhilippinesPolandPortugalRomaniaRussiaSaudi ArabiaScotlandSenegalSerbiaSierra LeoneSingaporeSomaliaSouth AfricaSouth AmericaSouth Central AsiaSouth Eastern AsiaSouthern EuropeSpainSri LankaSt. Vincent and the GrenadinesSudanSwedenSwitzerlandSyriaTaiwanThailandTrinidad and TobagoTurkeyUgandaUkraineUruguayUzbekistanVenezuelaVietnamWest IndiesWestern AfricaWestern AsiaWestern EuropeYemenZaireZimbabweAzores
Immigrants from Caribbean
Race
Ancestry
AfghanAfricanAlaska NativeAlaskan AthabascanAlbanianAleutAlsatianAmericanApacheArabArapahoArgentineanArmenianAssyrian/Chaldean/SyriacAustralianAustrianBahamianBangladeshiBarbadianBasqueBelgianBelizeanBermudanBhutaneseBlackfeetBolivianBrazilianBritishBritish West IndianBulgarianBurmeseCajunCambodianCanadianCape VerdeanCarpatho RusynCelticCentral AmericanCentral American IndianCherokeeCheyenneChickasawChileanChineseChippewaChoctawColombianColvilleComancheCosta RicanCreeCreekCroatianCrowCubanCypriotCzechCzechoslovakianDanishDelawareDominicanDutchDutch West IndianEastern EuropeanEcuadorianEgyptianEnglishEstonianEthiopianEuropeanFijianFilipinoFinnishFrenchFrench American IndianFrench CanadianGermanGerman RussianGhanaianGreekGuamanian/ChamorroGuatemalanGuyaneseHaitianHmongHonduranHopiHoumaHungarianIcelanderIndian (Asian)IndonesianInupiatIranianIraqiIrishIroquoisIsraeliItalianJamaicanJapaneseJordanianKenyanKiowaKoreanLaotianLatvianLebaneseLiberianLithuanianLumbeeLuxembourgerMacedonianMalaysianMalteseMarshalleseMenomineeMexicanMexican American IndianMongolianMoroccanNative HawaiianNavajoNepaleseNew ZealanderNicaraguanNigerianNorthern EuropeanNorwegianOkinawanOsageOttawaPaiutePakistaniPalestinianPanamanianParaguayanPennsylvania GermanPeruvianPimaPolishPortuguesePotawatomiPuebloPuerto RicanPuget Sound SalishRomanianRussianSalvadoranSamoanScandinavianScotch-IrishScottishSeminoleSenegaleseSerbianShoshoneSierra LeoneanSiouxSlavicSlovakSloveneSomaliSouth AfricanSouth AmericanSouth American IndianSoviet UnionSpaniardSpanishSpanish AmericanSpanish American IndianSri LankanSubsaharan AfricanSudaneseSwedishSwissSyrianTaiwaneseThaiTlingit-HaidaTohono O'OdhamTonganTrinidadian and TobagonianTsimshianTurkishU.S. Virgin IslanderUgandanUkrainianUruguayanUteVenezuelanVietnameseWelshWest IndianYakamaYaquiYugoslavianYumanYup'ikZimbabwean
Immigration
NonimmigrantsImmigrantsAfghanistanAfricaAlbaniaArgentinaArmeniaAsiaAustraliaAustriaBahamasBangladeshBarbadosBelarusBelgiumBelizeBoliviaBosnia and HerzegovinaBrazilBulgariaBurma/MyanmarCabo VerdeCambodiaCameroonCanadaCaribbeanCentral AmericaChileChinaColombiaCongoCosta RicaCroatiaCubaCzechoslovakiaDenmarkDominicaDominican RepublicEastern AfricaEastern AsiaEastern EuropeEcuadorEgyptEl SalvadorEnglandEritreaEthiopiaEuropeFijiFranceGermanyGhanaGreeceGrenadaGuatemalaGuyanaHaitiHondurasHong KongHungaryIndiaIndonesiaIranIraqIrelandIsraelItalyJamaicaJapanJordanKazakhstanKenyaKoreaKuwaitLaosLatin AmericaLatviaLebanonLiberiaLithuaniaMalaysiaMexicoMicronesiaMiddle AfricaMoldovaMoroccoNepalNetherlandsNicaraguaNigeriaNorth AmericaNorth MacedoniaNorthern AfricaNorthern EuropeNorwayOceaniaPakistanPanamaPeruPhilippinesPolandPortugalRomaniaRussiaSaudi ArabiaScotlandSenegalSerbiaSierra LeoneSingaporeSomaliaSouth AfricaSouth AmericaSouth Central AsiaSouth Eastern AsiaSouthern EuropeSpainSri LankaSt. Vincent and the GrenadinesSudanSwedenSwitzerlandSyriaTaiwanThailandTrinidad and TobagoTurkeyUgandaUkraineUruguayUzbekistanVenezuelaVietnamWest IndiesWestern AfricaWestern EuropeYemenZaireZimbabweAzores
5th Grade
Income
Poverty
Unemployment
Labor Participation
Family Structure
Vehicle Availability
Education Level
Disability

5th Grade Comparison

Immigrants from Western Asia

Immigrants from Caribbean

Tragic
Tragic
97.0%
5TH GRADE
4.3/ 100
METRIC RATING
230th/ 347
METRIC RANK
96.0%
5TH GRADE
0.0/ 100
METRIC RATING
307th/ 347
METRIC RANK

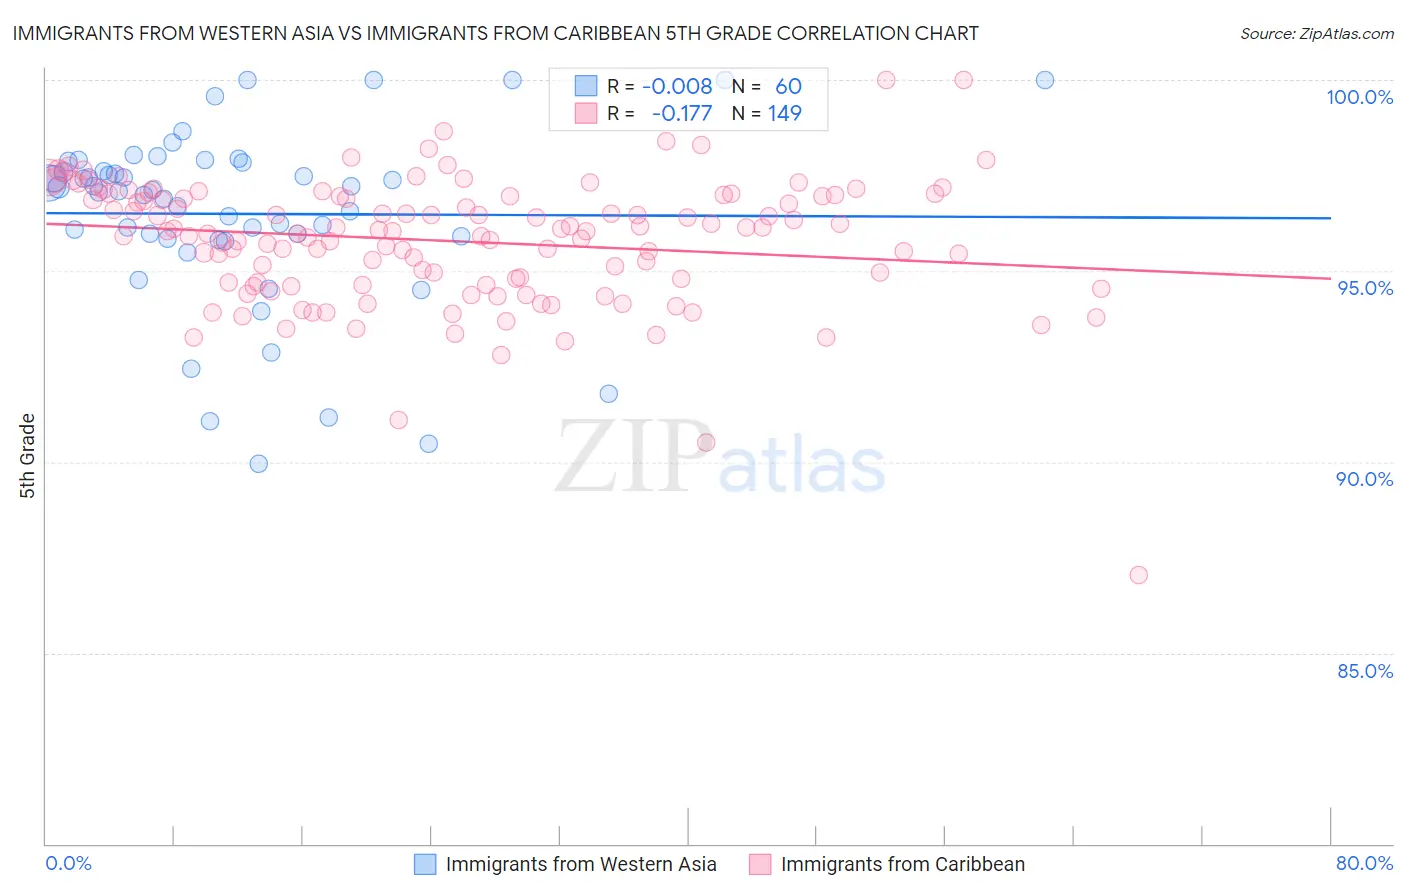
Immigrants from Western Asia vs Immigrants from Caribbean 5th Grade Correlation Chart

The statistical analysis conducted on geographies consisting of 404,424,892 people shows no correlation between the proportion of Immigrants from Western Asia and percentage of population with at least 5th grade education in the United States with a correlation coefficient (R) of -0.008 and weighted average of 97.0%. Similarly, the statistical analysis conducted on geographies consisting of 450,065,262 people shows a poor negative correlation between the proportion of Immigrants from Caribbean and percentage of population with at least 5th grade education in the United States with a correlation coefficient (R) of -0.177 and weighted average of 96.0%, a difference of 1.0%.
Immigrants from Western Asia vs Immigrants from Caribbean 5th Grade

5th Grade Correlation Summary

MeasurementImmigrants from Western AsiaImmigrants from Caribbean
Minimum90.0%87.0%
Maximum100.0%100.0%
Range10.0%13.0%
Mean96.5%95.8%
Median97.1%96.0%
Interquartile 25% (IQ1)95.9%94.7%
Interquartile 75% (IQ3)97.7%97.0%
Interquartile Range (IQR)1.9%2.3%
Standard Deviation (Sample)2.3%1.7%
Standard Deviation (Population)2.3%1.7%

Similar Demographics by 5th Grade

Demographics Similar to Immigrants from Western Asia by 5th Grade

In terms of 5th grade, the demographic groups most similar to Immigrants from Western Asia are Assyrian/Chaldean/Syriac (97.0%, a difference of 0.0%), Yuman (97.0%, a difference of 0.0%), Immigrants from Pakistan (97.0%, a difference of 0.010%), Immigrants from Malaysia (97.0%, a difference of 0.010%), and Immigrants from Eastern Asia (97.0%, a difference of 0.010%).
DemographicsRating | Rank5th Grade
Liberians
5.7
/100
|
#223
Tragic
97.0%
South American Indians
5.4
/100
|
#224
Tragic
97.0%
Bahamians
5.3
/100
|
#225
Tragic
97.0%
Tongans
5.3
/100
|
#226
Tragic
97.0%
Immigrants | Pakistan
4.7
/100
|
#227
Tragic
97.0%
Assyrians/Chaldeans/Syriacs
4.5
/100
|
#228
Tragic
97.0%
Yuman
4.5
/100
|
#229
Tragic
97.0%
Immigrants | Western Asia
4.3
/100
|
#230
Tragic
97.0%
Immigrants | Malaysia
4.1
/100
|
#231
Tragic
97.0%
Immigrants | Eastern Asia
4.0
/100
|
#232
Tragic
97.0%
Sub-Saharan Africans
3.3
/100
|
#233
Tragic
97.0%
Tohono O'odham
3.2
/100
|
#234
Tragic
97.0%
Uruguayans
3.2
/100
|
#235
Tragic
97.0%
Senegalese
2.8
/100
|
#236
Tragic
97.0%
Immigrants | Indonesia
2.0
/100
|
#237
Tragic
96.9%

Demographics Similar to Immigrants from Caribbean by 5th Grade

In terms of 5th grade, the demographic groups most similar to Immigrants from Caribbean are Immigrants from Haiti (96.0%, a difference of 0.0%), Ecuadorian (96.0%, a difference of 0.010%), Immigrants from Laos (96.0%, a difference of 0.020%), Immigrants from Guyana (96.0%, a difference of 0.020%), and Immigrants from Burma/Myanmar (96.1%, a difference of 0.030%).
DemographicsRating | Rank5th Grade
Sri Lankans
0.0
/100
|
#300
Tragic
96.1%
Immigrants | Cuba
0.0
/100
|
#301
Tragic
96.1%
Guyanese
0.0
/100
|
#302
Tragic
96.1%
Puerto Ricans
0.0
/100
|
#303
Tragic
96.1%
Immigrants | Burma/Myanmar
0.0
/100
|
#304
Tragic
96.1%
Immigrants | Laos
0.0
/100
|
#305
Tragic
96.0%
Immigrants | Haiti
0.0
/100
|
#306
Tragic
96.0%
Immigrants | Caribbean
0.0
/100
|
#307
Tragic
96.0%
Ecuadorians
0.0
/100
|
#308
Tragic
96.0%
Immigrants | Guyana
0.0
/100
|
#309
Tragic
96.0%
Indonesians
0.0
/100
|
#310
Tragic
96.0%
Immigrants | Bangladesh
0.0
/100
|
#311
Tragic
96.0%
Vietnamese
0.0
/100
|
#312
Tragic
95.9%
Bangladeshis
0.0
/100
|
#313
Tragic
95.9%
Immigrants | Portugal
0.0
/100
|
#314
Tragic
95.9%