Immigrants from Western Asia vs Burmese 9th Grade

COMPARE

Immigrants from Western Asia
Race
Ancestry
AfghanAfricanAlaska NativeAlaskan AthabascanAlbanianAleutAlsatianAmericanApacheArabArapahoArgentineanArmenianAssyrian/Chaldean/SyriacAustralianAustrianBahamianBangladeshiBarbadianBasqueBelgianBelizeanBermudanBhutaneseBlackfeetBolivianBrazilianBritishBritish West IndianBulgarianCajunCambodianCanadianCape VerdeanCarpatho RusynCelticCentral AmericanCentral American IndianCherokeeCheyenneChickasawChileanChineseChippewaChoctawColombianColvilleComancheCosta RicanCreeCreekCroatianCrowCubanCypriotCzechCzechoslovakianDanishDelawareDominicanDutchDutch West IndianEastern EuropeanEcuadorianEgyptianEnglishEstonianEthiopianEuropeanFijianFilipinoFinnishFrenchFrench American IndianFrench CanadianGermanGerman RussianGhanaianGreekGuamanian/ChamorroGuatemalanGuyaneseHaitianHmongHonduranHopiHoumaHungarianIcelanderIndian (Asian)IndonesianInupiatIranianIraqiIrishIroquoisIsraeliItalianJamaicanJapaneseJordanianKenyanKiowaKoreanLaotianLatvianLebaneseLiberianLithuanianLumbeeLuxembourgerMacedonianMalaysianMalteseMarshalleseMenomineeMexicanMexican American IndianMongolianMoroccanNative HawaiianNavajoNepaleseNew ZealanderNicaraguanNigerianNorthern EuropeanNorwegianOkinawanOsageOttawaPaiutePakistaniPalestinianPanamanianParaguayanPennsylvania GermanPeruvianPimaPolishPortuguesePotawatomiPuebloPuerto RicanPuget Sound SalishRomanianRussianSalvadoranSamoanScandinavianScotch-IrishScottishSeminoleSenegaleseSerbianShoshoneSierra LeoneanSiouxSlavicSlovakSloveneSomaliSouth AfricanSouth AmericanSouth American IndianSoviet UnionSpaniardSpanishSpanish AmericanSpanish American IndianSri LankanSubsaharan AfricanSudaneseSwedishSwissSyrianTaiwaneseThaiTlingit-HaidaTohono O'OdhamTonganTrinidadian and TobagonianTsimshianTurkishU.S. Virgin IslanderUgandanUkrainianUruguayanUteVenezuelanVietnameseWelshWest IndianYakamaYaquiYugoslavianYumanYup'ikZimbabwean
Immigration
NonimmigrantsImmigrantsAfghanistanAfricaAlbaniaArgentinaArmeniaAsiaAustraliaAustriaBahamasBangladeshBarbadosBelarusBelgiumBelizeBoliviaBosnia and HerzegovinaBrazilBulgariaBurma/MyanmarCabo VerdeCambodiaCameroonCanadaCaribbeanCentral AmericaChileChinaColombiaCongoCosta RicaCroatiaCubaCzechoslovakiaDenmarkDominicaDominican RepublicEastern AfricaEastern AsiaEastern EuropeEcuadorEgyptEl SalvadorEnglandEritreaEthiopiaEuropeFijiFranceGermanyGhanaGreeceGrenadaGuatemalaGuyanaHaitiHondurasHong KongHungaryIndiaIndonesiaIranIraqIrelandIsraelItalyJamaicaJapanJordanKazakhstanKenyaKoreaKuwaitLaosLatin AmericaLatviaLebanonLiberiaLithuaniaMalaysiaMexicoMicronesiaMiddle AfricaMoldovaMoroccoNepalNetherlandsNicaraguaNigeriaNorth AmericaNorth MacedoniaNorthern AfricaNorthern EuropeNorwayOceaniaPakistanPanamaPeruPhilippinesPolandPortugalRomaniaRussiaSaudi ArabiaScotlandSenegalSerbiaSierra LeoneSingaporeSomaliaSouth AfricaSouth AmericaSouth Central AsiaSouth Eastern AsiaSouthern EuropeSpainSri LankaSt. Vincent and the GrenadinesSudanSwedenSwitzerlandSyriaTaiwanThailandTrinidad and TobagoTurkeyUgandaUkraineUruguayUzbekistanVenezuelaVietnamWest IndiesWestern AfricaWestern AsiaWestern EuropeYemenZaireZimbabweAzores
Burmese
Race
Ancestry
AfghanAfricanAlaska NativeAlaskan AthabascanAlbanianAleutAlsatianAmericanApacheArabArapahoArgentineanArmenianAssyrian/Chaldean/SyriacAustralianAustrianBahamianBangladeshiBarbadianBasqueBelgianBelizeanBermudanBhutaneseBlackfeetBolivianBrazilianBritishBritish West IndianBulgarianBurmeseCajunCambodianCanadianCape VerdeanCarpatho RusynCelticCentral AmericanCentral American IndianCherokeeCheyenneChickasawChileanChineseChippewaChoctawColombianColvilleComancheCosta RicanCreeCreekCroatianCrowCubanCypriotCzechCzechoslovakianDanishDelawareDominicanDutchDutch West IndianEastern EuropeanEcuadorianEgyptianEnglishEstonianEthiopianEuropeanFijianFilipinoFinnishFrenchFrench American IndianFrench CanadianGermanGerman RussianGhanaianGreekGuamanian/ChamorroGuatemalanGuyaneseHaitianHmongHonduranHopiHoumaHungarianIcelanderIndian (Asian)IndonesianInupiatIranianIraqiIrishIroquoisIsraeliItalianJamaicanJapaneseJordanianKenyanKiowaKoreanLaotianLatvianLebaneseLiberianLithuanianLumbeeLuxembourgerMacedonianMalaysianMalteseMarshalleseMenomineeMexicanMexican American IndianMongolianMoroccanNative HawaiianNavajoNepaleseNew ZealanderNicaraguanNigerianNorthern EuropeanNorwegianOkinawanOsageOttawaPaiutePakistaniPalestinianPanamanianParaguayanPennsylvania GermanPeruvianPimaPolishPortuguesePotawatomiPuebloPuerto RicanPuget Sound SalishRomanianRussianSalvadoranSamoanScandinavianScotch-IrishScottishSeminoleSenegaleseSerbianShoshoneSierra LeoneanSiouxSlavicSlovakSloveneSomaliSouth AfricanSouth AmericanSouth American IndianSoviet UnionSpaniardSpanishSpanish AmericanSpanish American IndianSri LankanSubsaharan AfricanSudaneseSwedishSwissSyrianTaiwaneseThaiTlingit-HaidaTohono O'OdhamTonganTrinidadian and TobagonianTsimshianTurkishU.S. Virgin IslanderUgandanUkrainianUruguayanUteVenezuelanVietnameseWelshWest IndianYakamaYaquiYugoslavianYumanYup'ikZimbabwean
Immigration
NonimmigrantsImmigrantsAfghanistanAfricaAlbaniaArgentinaArmeniaAsiaAustraliaAustriaBahamasBangladeshBarbadosBelarusBelgiumBelizeBoliviaBosnia and HerzegovinaBrazilBulgariaBurma/MyanmarCabo VerdeCambodiaCameroonCanadaCaribbeanCentral AmericaChileChinaColombiaCongoCosta RicaCroatiaCubaCzechoslovakiaDenmarkDominicaDominican RepublicEastern AfricaEastern AsiaEastern EuropeEcuadorEgyptEl SalvadorEnglandEritreaEthiopiaEuropeFijiFranceGermanyGhanaGreeceGrenadaGuatemalaGuyanaHaitiHondurasHong KongHungaryIndiaIndonesiaIranIraqIrelandIsraelItalyJamaicaJapanJordanKazakhstanKenyaKoreaKuwaitLaosLatin AmericaLatviaLebanonLiberiaLithuaniaMalaysiaMexicoMicronesiaMiddle AfricaMoldovaMoroccoNepalNetherlandsNicaraguaNigeriaNorth AmericaNorth MacedoniaNorthern AfricaNorthern EuropeNorwayOceaniaPakistanPanamaPeruPhilippinesPolandPortugalRomaniaRussiaSaudi ArabiaScotlandSenegalSerbiaSierra LeoneSingaporeSomaliaSouth AfricaSouth AmericaSouth Central AsiaSouth Eastern AsiaSouthern EuropeSpainSri LankaSt. Vincent and the GrenadinesSudanSwedenSwitzerlandSyriaTaiwanThailandTrinidad and TobagoTurkeyUgandaUkraineUruguayUzbekistanVenezuelaVietnamWest IndiesWestern AfricaWestern EuropeYemenZaireZimbabweAzores
9th Grade
Income
Poverty
Unemployment
Labor Participation
Family Structure
Vehicle Availability
Education Level
Disability

9th Grade Comparison

Immigrants from Western Asia

Burmese

Poor
Exceptional
94.5%
9TH GRADE
10.7/ 100
METRIC RATING
216th/ 347
METRIC RANK
95.4%
9TH GRADE
96.0/ 100
METRIC RATING
115th/ 347
METRIC RANK

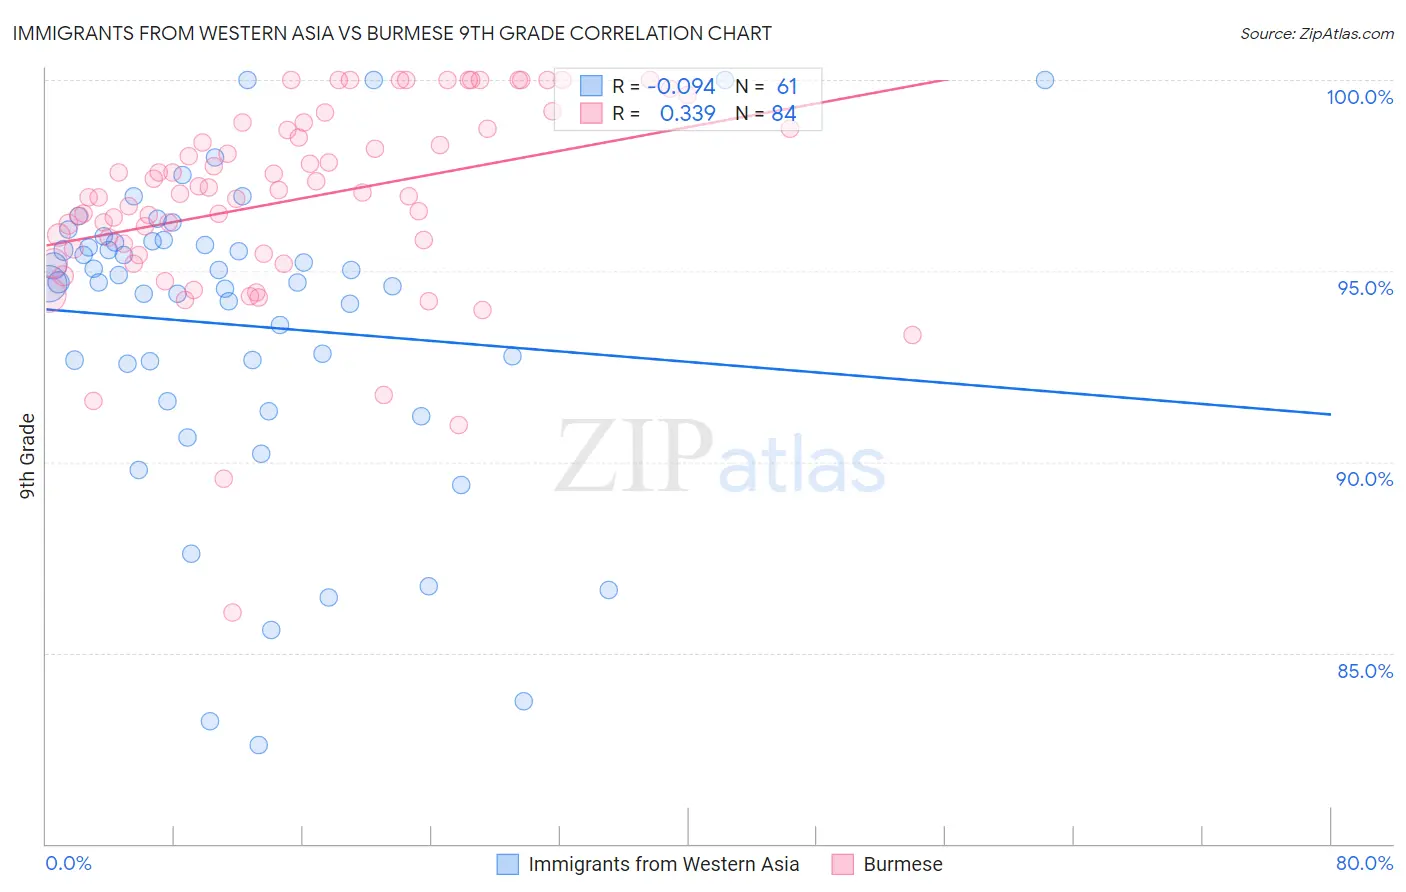
Immigrants from Western Asia vs Burmese 9th Grade Correlation Chart

The statistical analysis conducted on geographies consisting of 404,433,811 people shows a slight negative correlation between the proportion of Immigrants from Western Asia and percentage of population with at least 9th grade education in the United States with a correlation coefficient (R) of -0.094 and weighted average of 94.5%. Similarly, the statistical analysis conducted on geographies consisting of 465,275,888 people shows a mild positive correlation between the proportion of Burmese and percentage of population with at least 9th grade education in the United States with a correlation coefficient (R) of 0.339 and weighted average of 95.4%, a difference of 0.98%.
Immigrants from Western Asia vs Burmese 9th Grade

9th Grade Correlation Summary

MeasurementImmigrants from Western AsiaBurmese
Minimum82.6%86.1%
Maximum100.0%100.0%
Range17.4%13.9%
Mean93.6%96.9%
Median94.7%97.0%
Interquartile 25% (IQ1)92.1%95.5%
Interquartile 75% (IQ3)95.8%98.7%
Interquartile Range (IQR)3.7%3.2%
Standard Deviation (Sample)4.0%2.6%
Standard Deviation (Population)4.0%2.6%

Similar Demographics by 9th Grade

Demographics Similar to Immigrants from Western Asia by 9th Grade

In terms of 9th grade, the demographic groups most similar to Immigrants from Western Asia are Immigrants from Syria (94.5%, a difference of 0.010%), Immigrants from Liberia (94.5%, a difference of 0.020%), Asian (94.5%, a difference of 0.020%), Immigrants from Indonesia (94.5%, a difference of 0.030%), and Immigrants from Malaysia (94.5%, a difference of 0.030%).
DemographicsRating | Rank9th Grade
Comanche
14.9
/100
|
#209
Poor
94.6%
Immigrants | Chile
13.4
/100
|
#210
Poor
94.5%
Immigrants | Indonesia
12.3
/100
|
#211
Poor
94.5%
Immigrants | Malaysia
12.2
/100
|
#212
Poor
94.5%
Immigrants | Oceania
12.1
/100
|
#213
Poor
94.5%
Immigrants | Liberia
11.8
/100
|
#214
Poor
94.5%
Immigrants | Syria
11.0
/100
|
#215
Poor
94.5%
Immigrants | Western Asia
10.7
/100
|
#216
Poor
94.5%
Asians
9.9
/100
|
#217
Tragic
94.5%
Portuguese
9.2
/100
|
#218
Tragic
94.5%
Africans
9.0
/100
|
#219
Tragic
94.5%
Indians (Asian)
8.6
/100
|
#220
Tragic
94.5%
Immigrants | Eastern Africa
8.2
/100
|
#221
Tragic
94.5%
Immigrants | Asia
7.7
/100
|
#222
Tragic
94.4%
Bahamians
7.0
/100
|
#223
Tragic
94.4%

Demographics Similar to Burmese by 9th Grade

In terms of 9th grade, the demographic groups most similar to Burmese are German Russian (95.4%, a difference of 0.0%), Cherokee (95.4%, a difference of 0.010%), Immigrants from Croatia (95.4%, a difference of 0.010%), Iroquois (95.4%, a difference of 0.010%), and Immigrants from Europe (95.4%, a difference of 0.010%).
DemographicsRating | Rank9th Grade
Chickasaw
96.8
/100
|
#108
Exceptional
95.5%
Osage
96.8
/100
|
#109
Exceptional
95.5%
Immigrants | Bulgaria
96.7
/100
|
#110
Exceptional
95.5%
Cherokee
96.3
/100
|
#111
Exceptional
95.4%
Immigrants | Croatia
96.2
/100
|
#112
Exceptional
95.4%
Iroquois
96.2
/100
|
#113
Exceptional
95.4%
German Russians
96.1
/100
|
#114
Exceptional
95.4%
Burmese
96.0
/100
|
#115
Exceptional
95.4%
Immigrants | Europe
95.7
/100
|
#116
Exceptional
95.4%
Immigrants | Romania
95.6
/100
|
#117
Exceptional
95.4%
Immigrants | Turkey
95.6
/100
|
#118
Exceptional
95.4%
Soviet Union
95.6
/100
|
#119
Exceptional
95.4%
Cambodians
95.6
/100
|
#120
Exceptional
95.4%
Cree
95.5
/100
|
#121
Exceptional
95.4%
Immigrants | Kuwait
95.5
/100
|
#122
Exceptional
95.4%