Immigrants from Vietnam vs Immigrants from Indonesia 9th Grade
COMPARE
Immigrants from Vietnam
Immigrants from Indonesia
9th Grade
9th Grade Comparison
Immigrants from Vietnam
Immigrants from Indonesia
92.6%
9TH GRADE
0.0/ 100
METRIC RATING
306th/ 347
METRIC RANK
94.5%
9TH GRADE
12.3/ 100
METRIC RATING
211th/ 347
METRIC RANK
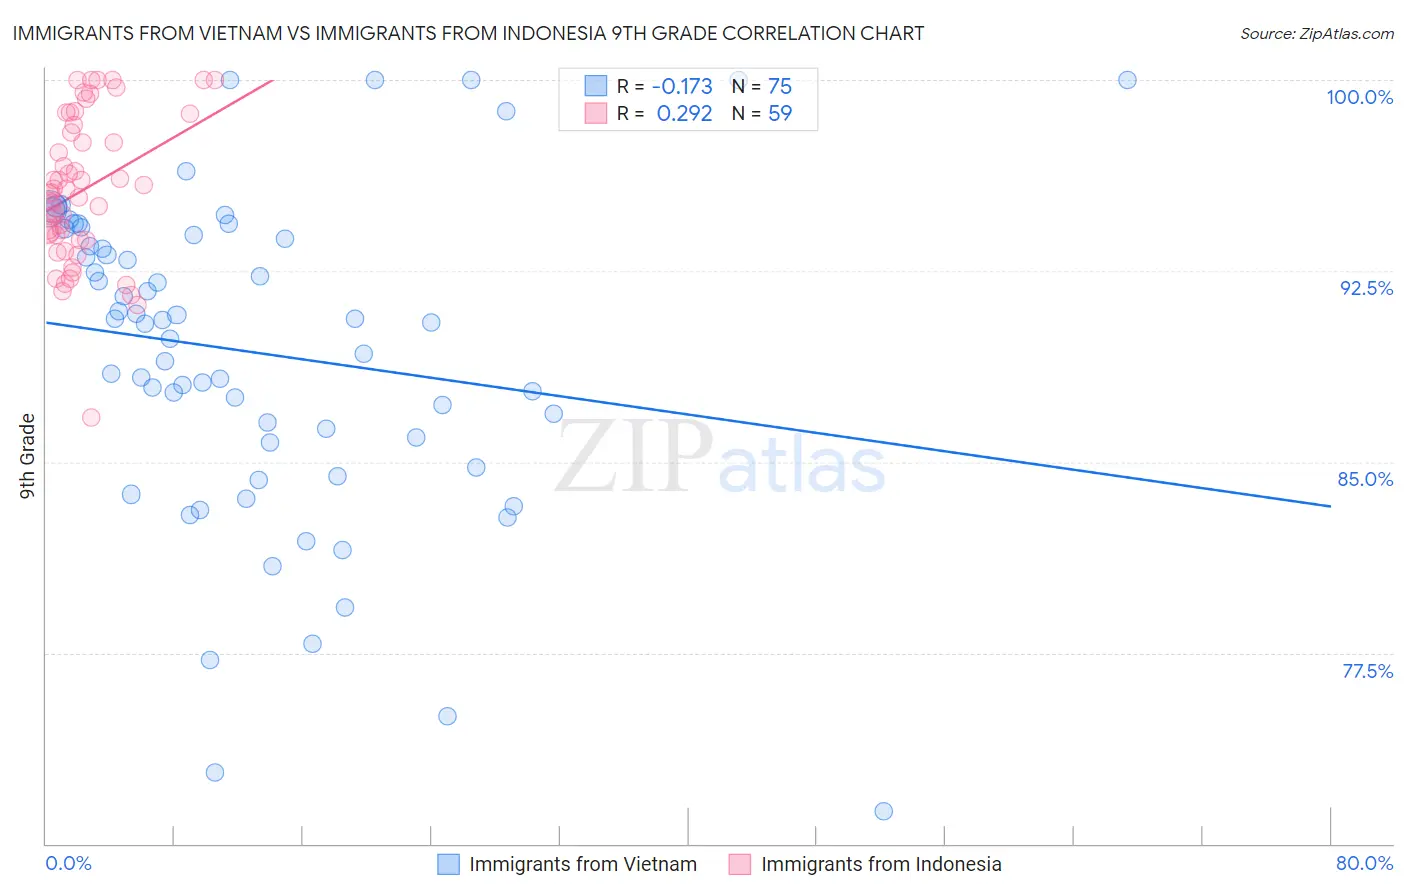
Immigrants from Vietnam vs Immigrants from Indonesia 9th Grade Correlation Chart
The statistical analysis conducted on geographies consisting of 404,843,921 people shows a poor negative correlation between the proportion of Immigrants from Vietnam and percentage of population with at least 9th grade education in the United States with a correlation coefficient (R) of -0.173 and weighted average of 92.6%. Similarly, the statistical analysis conducted on geographies consisting of 215,671,959 people shows a weak positive correlation between the proportion of Immigrants from Indonesia and percentage of population with at least 9th grade education in the United States with a correlation coefficient (R) of 0.292 and weighted average of 94.5%, a difference of 2.1%.
9th Grade Correlation Summary
| Measurement | Immigrants from Vietnam | Immigrants from Indonesia |
| Minimum | 71.3% | 86.7% |
| Maximum | 100.0% | 100.0% |
| Range | 28.7% | 13.3% |
| Mean | 89.3% | 95.7% |
| Median | 90.5% | 95.6% |
| Interquartile 25% (IQ1) | 85.8% | 93.7% |
| Interquartile 75% (IQ3) | 93.9% | 98.2% |
| Interquartile Range (IQR) | 8.2% | 4.5% |
| Standard Deviation (Sample) | 6.3% | 2.9% |
| Standard Deviation (Population) | 6.2% | 2.9% |
Similar Demographics by 9th Grade
Demographics Similar to Immigrants from Vietnam by 9th Grade
In terms of 9th grade, the demographic groups most similar to Immigrants from Vietnam are Japanese (92.6%, a difference of 0.0%), Tohono O'odham (92.6%, a difference of 0.020%), Guyanese (92.7%, a difference of 0.040%), Immigrants from Dominica (92.7%, a difference of 0.060%), and Immigrants (92.5%, a difference of 0.10%).
| Demographics | Rating | Rank | 9th Grade |
| Immigrants | Grenada | 0.0 /100 | #299 | Tragic 93.0% |
| Yaqui | 0.0 /100 | #300 | Tragic 92.9% |
| Immigrants | Haiti | 0.0 /100 | #301 | Tragic 92.7% |
| Immigrants | Dominica | 0.0 /100 | #302 | Tragic 92.7% |
| Guyanese | 0.0 /100 | #303 | Tragic 92.7% |
| Tohono O'odham | 0.0 /100 | #304 | Tragic 92.6% |
| Japanese | 0.0 /100 | #305 | Tragic 92.6% |
| Immigrants | Vietnam | 0.0 /100 | #306 | Tragic 92.6% |
| Immigrants | Immigrants | 0.0 /100 | #307 | Tragic 92.5% |
| Immigrants | Guyana | 0.0 /100 | #308 | Tragic 92.5% |
| Immigrants | Bangladesh | 0.0 /100 | #309 | Tragic 92.4% |
| Immigrants | Cambodia | 0.0 /100 | #310 | Tragic 92.4% |
| Immigrants | Fiji | 0.0 /100 | #311 | Tragic 92.3% |
| Houma | 0.0 /100 | #312 | Tragic 92.3% |
| Vietnamese | 0.0 /100 | #313 | Tragic 92.3% |
Demographics Similar to Immigrants from Indonesia by 9th Grade
In terms of 9th grade, the demographic groups most similar to Immigrants from Indonesia are Immigrants from Malaysia (94.5%, a difference of 0.0%), Immigrants from Oceania (94.5%, a difference of 0.0%), Immigrants from Liberia (94.5%, a difference of 0.010%), Immigrants from Chile (94.5%, a difference of 0.020%), and Immigrants from Syria (94.5%, a difference of 0.020%).
| Demographics | Rating | Rank | 9th Grade |
| Moroccans | 19.6 /100 | #204 | Poor 94.6% |
| Immigrants | Sudan | 17.6 /100 | #205 | Poor 94.6% |
| Samoans | 17.3 /100 | #206 | Poor 94.6% |
| Immigrants | Morocco | 16.3 /100 | #207 | Poor 94.6% |
| Immigrants | Pakistan | 15.5 /100 | #208 | Poor 94.6% |
| Comanche | 14.9 /100 | #209 | Poor 94.6% |
| Immigrants | Chile | 13.4 /100 | #210 | Poor 94.5% |
| Immigrants | Indonesia | 12.3 /100 | #211 | Poor 94.5% |
| Immigrants | Malaysia | 12.2 /100 | #212 | Poor 94.5% |
| Immigrants | Oceania | 12.1 /100 | #213 | Poor 94.5% |
| Immigrants | Liberia | 11.8 /100 | #214 | Poor 94.5% |
| Immigrants | Syria | 11.0 /100 | #215 | Poor 94.5% |
| Immigrants | Western Asia | 10.7 /100 | #216 | Poor 94.5% |
| Asians | 9.9 /100 | #217 | Tragic 94.5% |
| Portuguese | 9.2 /100 | #218 | Tragic 94.5% |