Immigrants from Venezuela vs Sri Lankan Bachelor's Degree
COMPARE
Immigrants from Venezuela
Sri Lankan
Bachelor's Degree
Bachelor's Degree Comparison
Immigrants from Venezuela
Sri Lankans
40.2%
BACHELOR'S DEGREE
92.9/ 100
METRIC RATING
128th/ 347
METRIC RANK
38.2%
BACHELOR'S DEGREE
59.1/ 100
METRIC RATING
165th/ 347
METRIC RANK
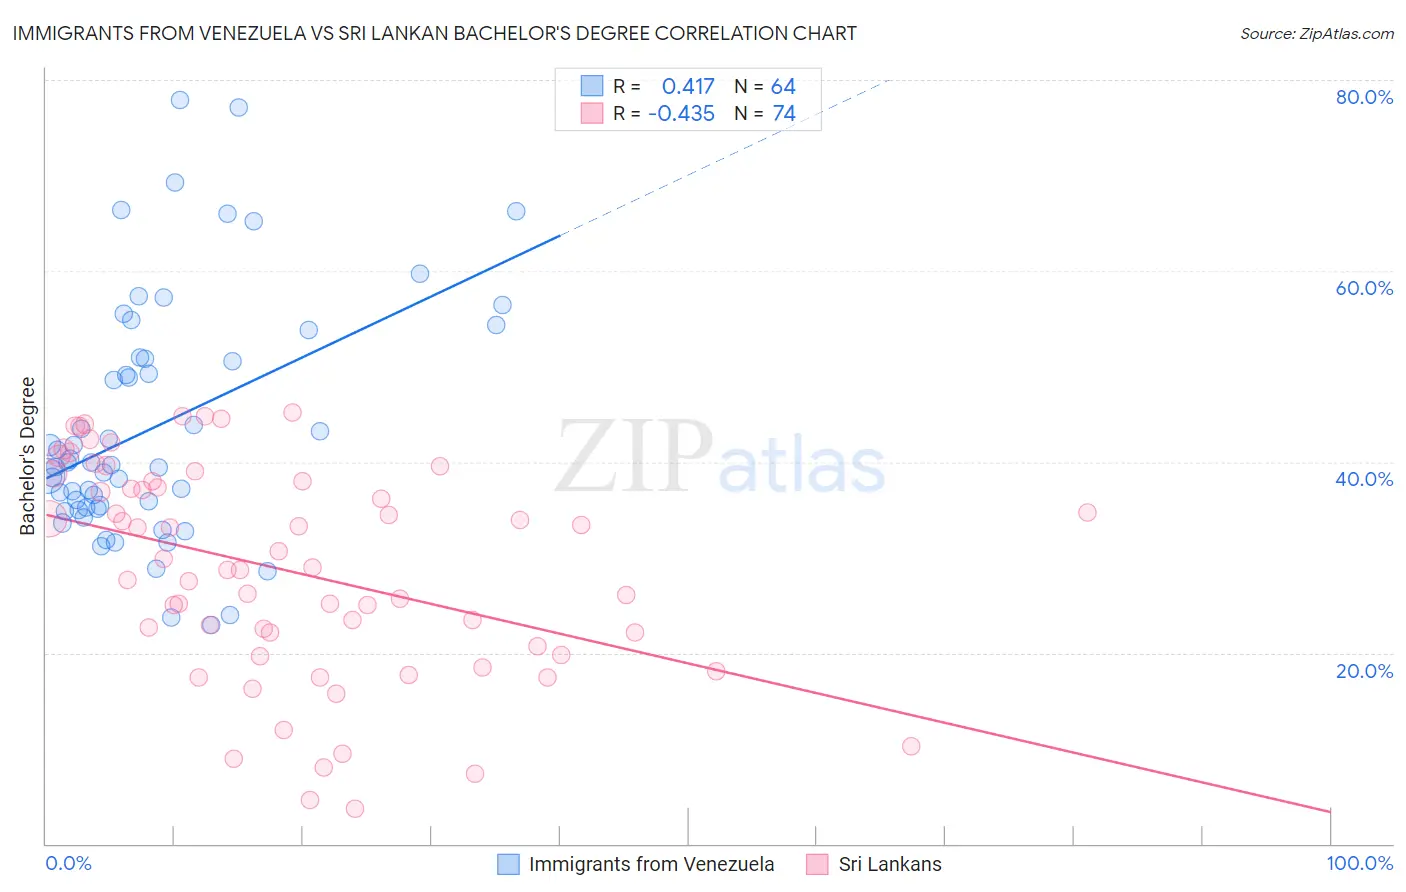
Immigrants from Venezuela vs Sri Lankan Bachelor's Degree Correlation Chart
The statistical analysis conducted on geographies consisting of 287,853,697 people shows a moderate positive correlation between the proportion of Immigrants from Venezuela and percentage of population with at least bachelor's degree education in the United States with a correlation coefficient (R) of 0.417 and weighted average of 40.2%. Similarly, the statistical analysis conducted on geographies consisting of 440,520,330 people shows a moderate negative correlation between the proportion of Sri Lankans and percentage of population with at least bachelor's degree education in the United States with a correlation coefficient (R) of -0.435 and weighted average of 38.2%, a difference of 5.3%.
Bachelor's Degree Correlation Summary
| Measurement | Immigrants from Venezuela | Sri Lankan |
| Minimum | 22.9% | 3.7% |
| Maximum | 77.9% | 45.1% |
| Range | 55.1% | 41.4% |
| Mean | 43.7% | 28.6% |
| Median | 39.8% | 28.8% |
| Interquartile 25% (IQ1) | 35.2% | 20.6% |
| Interquartile 75% (IQ3) | 50.9% | 37.9% |
| Interquartile Range (IQR) | 15.7% | 17.3% |
| Standard Deviation (Sample) | 12.7% | 11.1% |
| Standard Deviation (Population) | 12.6% | 11.0% |
Similar Demographics by Bachelor's Degree
Demographics Similar to Immigrants from Venezuela by Bachelor's Degree
In terms of bachelor's degree, the demographic groups most similar to Immigrants from Venezuela are Immigrants from Jordan (40.3%, a difference of 0.17%), Serbian (40.1%, a difference of 0.17%), Sierra Leonean (40.1%, a difference of 0.24%), Italian (40.1%, a difference of 0.32%), and Immigrants from Eastern Africa (40.4%, a difference of 0.46%).
| Demographics | Rating | Rank | Bachelor's Degree |
| Moroccans | 94.6 /100 | #121 | Exceptional 40.5% |
| Immigrants | Albania | 94.4 /100 | #122 | Exceptional 40.4% |
| Lebanese | 94.3 /100 | #123 | Exceptional 40.4% |
| Immigrants | Eritrea | 94.3 /100 | #124 | Exceptional 40.4% |
| British | 94.2 /100 | #125 | Exceptional 40.4% |
| Immigrants | Eastern Africa | 94.1 /100 | #126 | Exceptional 40.4% |
| Immigrants | Jordan | 93.4 /100 | #127 | Exceptional 40.3% |
| Immigrants | Venezuela | 92.9 /100 | #128 | Exceptional 40.2% |
| Serbians | 92.4 /100 | #129 | Exceptional 40.1% |
| Sierra Leoneans | 92.2 /100 | #130 | Exceptional 40.1% |
| Italians | 91.9 /100 | #131 | Exceptional 40.1% |
| Taiwanese | 91.1 /100 | #132 | Exceptional 40.0% |
| Immigrants | Southern Europe | 91.1 /100 | #133 | Exceptional 40.0% |
| Assyrians/Chaldeans/Syriacs | 89.4 /100 | #134 | Excellent 39.8% |
| Luxembourgers | 89.1 /100 | #135 | Excellent 39.8% |
Demographics Similar to Sri Lankans by Bachelor's Degree
In terms of bachelor's degree, the demographic groups most similar to Sri Lankans are Somali (38.1%, a difference of 0.050%), Scottish (38.1%, a difference of 0.25%), Danish (38.1%, a difference of 0.29%), Hungarian (38.3%, a difference of 0.30%), and Ghanaian (38.0%, a difference of 0.37%).
| Demographics | Rating | Rank | Bachelor's Degree |
| Immigrants | Germany | 69.6 /100 | #158 | Good 38.6% |
| Chinese | 66.6 /100 | #159 | Good 38.5% |
| Vietnamese | 66.6 /100 | #160 | Good 38.5% |
| Uruguayans | 65.8 /100 | #161 | Good 38.4% |
| Colombians | 65.0 /100 | #162 | Good 38.4% |
| Peruvians | 63.4 /100 | #163 | Good 38.3% |
| Hungarians | 62.1 /100 | #164 | Good 38.3% |
| Sri Lankans | 59.1 /100 | #165 | Average 38.2% |
| Somalis | 58.6 /100 | #166 | Average 38.1% |
| Scottish | 56.6 /100 | #167 | Average 38.1% |
| Danes | 56.2 /100 | #168 | Average 38.1% |
| Ghanaians | 55.3 /100 | #169 | Average 38.0% |
| Czechs | 54.4 /100 | #170 | Average 38.0% |
| Bermudans | 54.2 /100 | #171 | Average 38.0% |
| Immigrants | Somalia | 52.8 /100 | #172 | Average 37.9% |