Immigrants from Venezuela vs Immigrants from Lebanon No Schooling Completed
COMPARE
Immigrants from Venezuela
Immigrants from Lebanon
No Schooling Completed
No Schooling Completed Comparison
Immigrants from Venezuela
Immigrants from Lebanon
2.0%
NO SCHOOLING COMPLETED
68.5/ 100
METRIC RATING
154th/ 347
METRIC RANK
2.3%
NO SCHOOLING COMPLETED
4.5/ 100
METRIC RATING
223rd/ 347
METRIC RANK
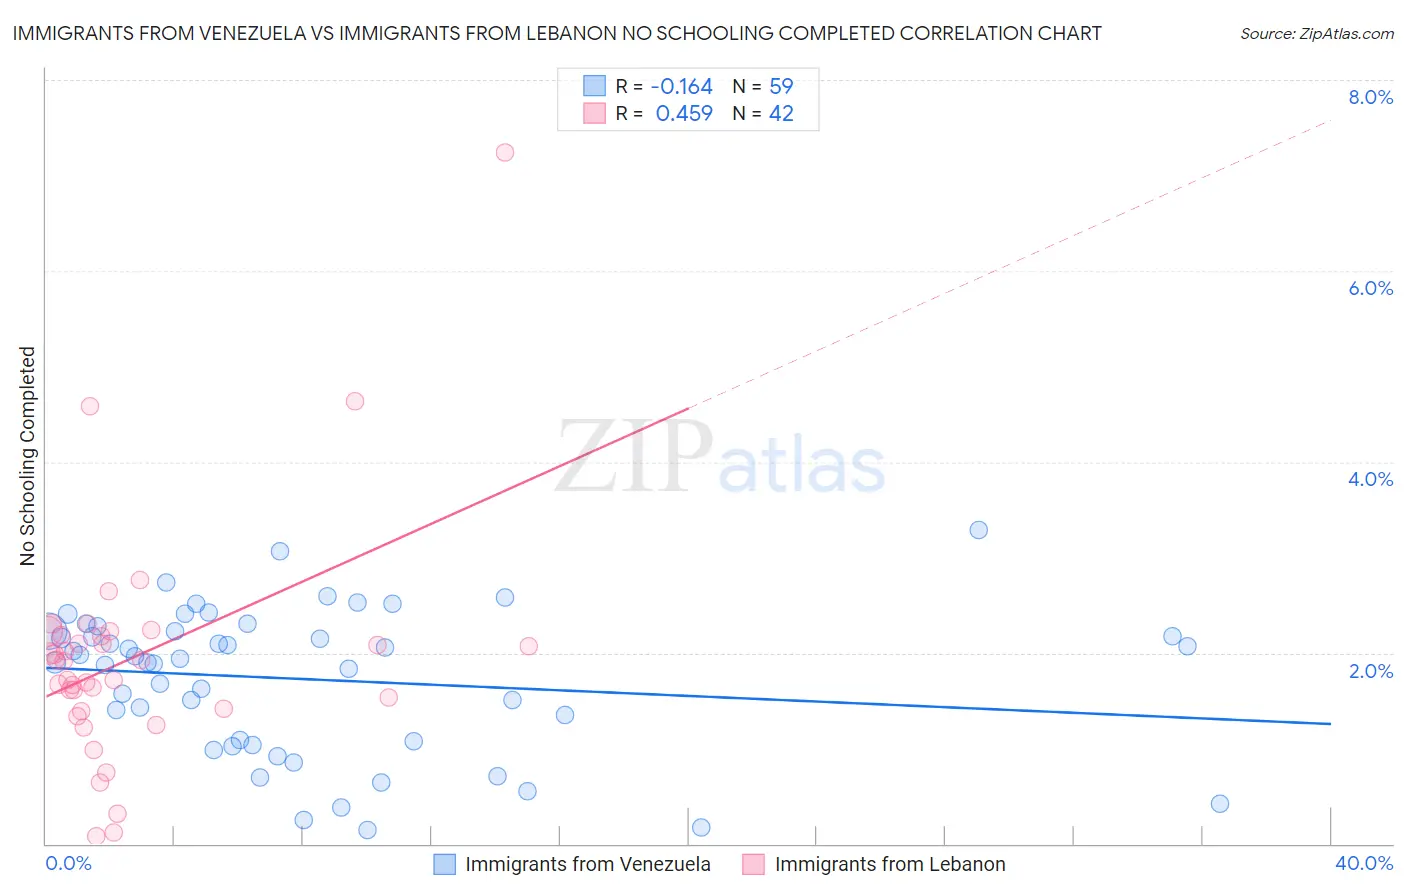
Immigrants from Venezuela vs Immigrants from Lebanon No Schooling Completed Correlation Chart
The statistical analysis conducted on geographies consisting of 286,388,596 people shows a poor negative correlation between the proportion of Immigrants from Venezuela and percentage of population with no schooling in the United States with a correlation coefficient (R) of -0.164 and weighted average of 2.0%. Similarly, the statistical analysis conducted on geographies consisting of 216,259,293 people shows a moderate positive correlation between the proportion of Immigrants from Lebanon and percentage of population with no schooling in the United States with a correlation coefficient (R) of 0.459 and weighted average of 2.3%, a difference of 13.2%.
No Schooling Completed Correlation Summary
| Measurement | Immigrants from Venezuela | Immigrants from Lebanon |
| Minimum | 0.14% | 0.079% |
| Maximum | 3.3% | 7.2% |
| Range | 3.1% | 7.2% |
| Mean | 1.7% | 2.0% |
| Median | 1.9% | 1.9% |
| Interquartile 25% (IQ1) | 1.1% | 1.4% |
| Interquartile 75% (IQ3) | 2.2% | 2.2% |
| Interquartile Range (IQR) | 1.2% | 0.77% |
| Standard Deviation (Sample) | 0.75% | 1.2% |
| Standard Deviation (Population) | 0.75% | 1.2% |
Similar Demographics by No Schooling Completed
Demographics Similar to Immigrants from Venezuela by No Schooling Completed
In terms of no schooling completed, the demographic groups most similar to Immigrants from Venezuela are Immigrants from Italy (2.0%, a difference of 0.060%), Immigrants from Russia (2.0%, a difference of 0.14%), Chilean (2.0%, a difference of 0.21%), Immigrants from Sri Lanka (2.0%, a difference of 0.24%), and Immigrants from Korea (2.0%, a difference of 0.29%).
| Demographics | Rating | Rank | No Schooling Completed |
| Soviet Union | 77.1 /100 | #147 | Good 2.0% |
| Shoshone | 76.7 /100 | #148 | Good 2.0% |
| Immigrants | North Macedonia | 75.9 /100 | #149 | Good 2.0% |
| Blackfeet | 72.9 /100 | #150 | Good 2.0% |
| Immigrants | Jordan | 70.9 /100 | #151 | Good 2.0% |
| Immigrants | Eastern Europe | 70.4 /100 | #152 | Good 2.0% |
| Immigrants | Italy | 68.9 /100 | #153 | Good 2.0% |
| Immigrants | Venezuela | 68.5 /100 | #154 | Good 2.0% |
| Immigrants | Russia | 67.6 /100 | #155 | Good 2.0% |
| Chileans | 67.2 /100 | #156 | Good 2.0% |
| Immigrants | Sri Lanka | 67.0 /100 | #157 | Good 2.0% |
| Immigrants | Korea | 66.7 /100 | #158 | Good 2.0% |
| Immigrants | Spain | 66.4 /100 | #159 | Good 2.0% |
| Kenyans | 65.7 /100 | #160 | Good 2.0% |
| Ugandans | 64.6 /100 | #161 | Good 2.0% |
Demographics Similar to Immigrants from Lebanon by No Schooling Completed
In terms of no schooling completed, the demographic groups most similar to Immigrants from Lebanon are Subsaharan African (2.3%, a difference of 0.15%), Tohono O'odham (2.3%, a difference of 0.29%), Sudanese (2.3%, a difference of 0.29%), Sierra Leonean (2.3%, a difference of 0.30%), and Immigrants from Sudan (2.3%, a difference of 0.33%).
| Demographics | Rating | Rank | No Schooling Completed |
| Tongans | 6.8 /100 | #216 | Tragic 2.3% |
| Immigrants | Syria | 6.6 /100 | #217 | Tragic 2.3% |
| Immigrants | Nepal | 6.4 /100 | #218 | Tragic 2.3% |
| Senegalese | 5.6 /100 | #219 | Tragic 2.3% |
| Immigrants | Costa Rica | 5.1 /100 | #220 | Tragic 2.3% |
| Immigrants | Sudan | 5.0 /100 | #221 | Tragic 2.3% |
| Sub-Saharan Africans | 4.7 /100 | #222 | Tragic 2.3% |
| Immigrants | Lebanon | 4.5 /100 | #223 | Tragic 2.3% |
| Tohono O'odham | 4.1 /100 | #224 | Tragic 2.3% |
| Sudanese | 4.1 /100 | #225 | Tragic 2.3% |
| Sierra Leoneans | 4.1 /100 | #226 | Tragic 2.3% |
| Immigrants | Uganda | 4.0 /100 | #227 | Tragic 2.3% |
| U.S. Virgin Islanders | 3.7 /100 | #228 | Tragic 2.3% |
| Immigrants | Pakistan | 3.6 /100 | #229 | Tragic 2.3% |
| Puerto Ricans | 3.4 /100 | #230 | Tragic 2.3% |