Immigrants from Uzbekistan vs Swiss Bachelor's Degree
COMPARE
Immigrants from Uzbekistan
Swiss
Bachelor's Degree
Bachelor's Degree Comparison
Immigrants from Uzbekistan
Swiss
42.8%
BACHELOR'S DEGREE
99.5/ 100
METRIC RATING
73rd/ 347
METRIC RANK
37.2%
BACHELOR'S DEGREE
34.1/ 100
METRIC RATING
190th/ 347
METRIC RANK
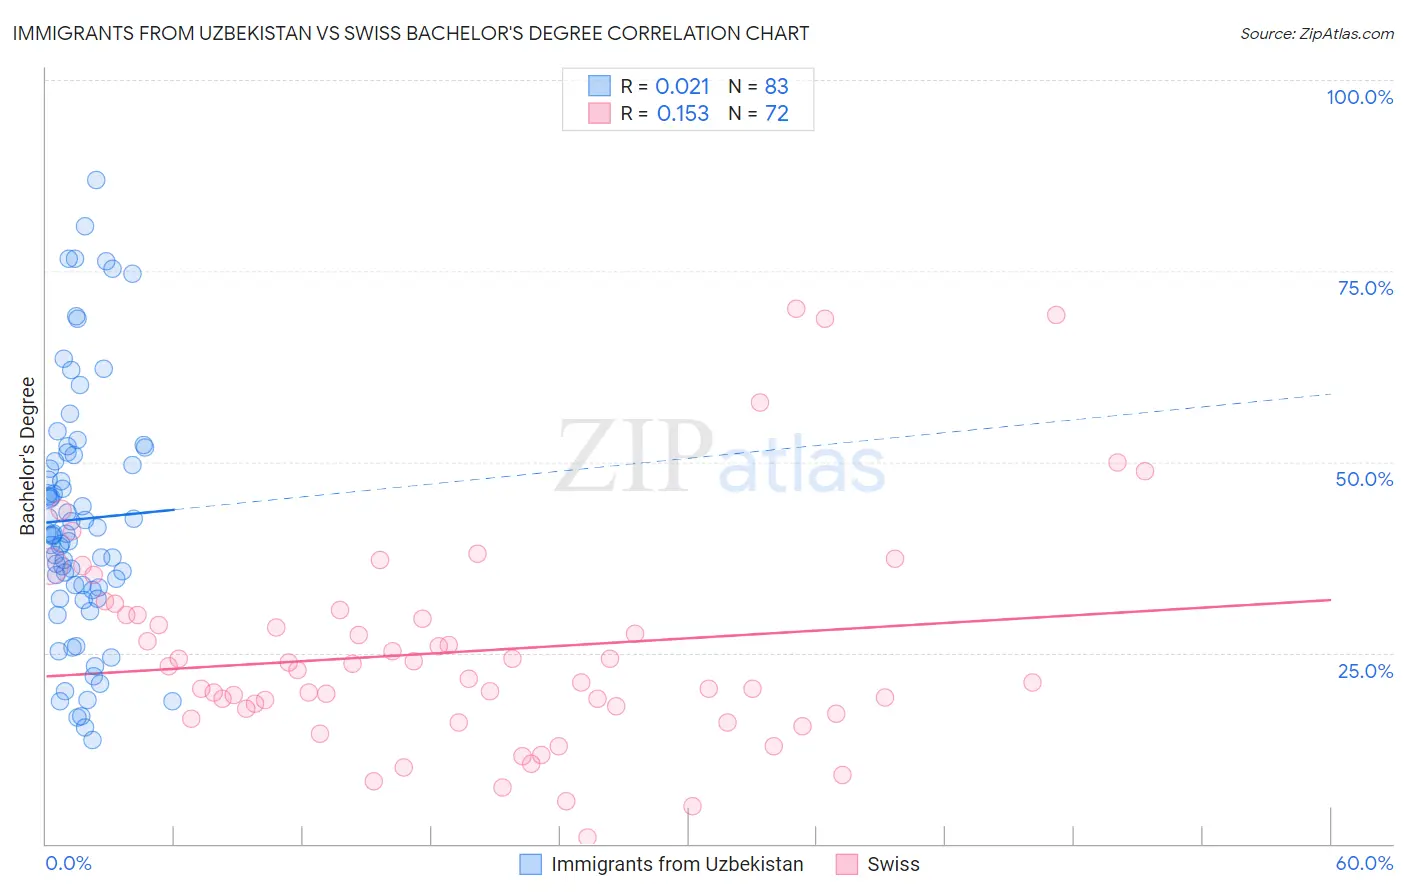
Immigrants from Uzbekistan vs Swiss Bachelor's Degree Correlation Chart
The statistical analysis conducted on geographies consisting of 118,752,495 people shows no correlation between the proportion of Immigrants from Uzbekistan and percentage of population with at least bachelor's degree education in the United States with a correlation coefficient (R) of 0.021 and weighted average of 42.8%. Similarly, the statistical analysis conducted on geographies consisting of 464,980,651 people shows a poor positive correlation between the proportion of Swiss and percentage of population with at least bachelor's degree education in the United States with a correlation coefficient (R) of 0.153 and weighted average of 37.2%, a difference of 14.9%.
Bachelor's Degree Correlation Summary
| Measurement | Immigrants from Uzbekistan | Swiss |
| Minimum | 13.6% | 0.82% |
| Maximum | 86.9% | 70.0% |
| Range | 73.3% | 69.2% |
| Mean | 42.5% | 25.2% |
| Median | 40.5% | 22.2% |
| Interquartile 25% (IQ1) | 33.2% | 17.3% |
| Interquartile 75% (IQ3) | 50.9% | 29.9% |
| Interquartile Range (IQR) | 17.6% | 12.6% |
| Standard Deviation (Sample) | 16.4% | 14.1% |
| Standard Deviation (Population) | 16.3% | 14.0% |
Similar Demographics by Bachelor's Degree
Demographics Similar to Immigrants from Uzbekistan by Bachelor's Degree
In terms of bachelor's degree, the demographic groups most similar to Immigrants from Uzbekistan are Ethiopian (42.8%, a difference of 0.050%), Immigrants from Argentina (42.8%, a difference of 0.14%), Bhutanese (42.7%, a difference of 0.22%), Immigrants from Romania (42.9%, a difference of 0.40%), and Immigrants from Zimbabwe (42.6%, a difference of 0.44%).
| Demographics | Rating | Rank | Bachelor's Degree |
| Immigrants | Netherlands | 99.7 /100 | #66 | Exceptional 43.3% |
| Egyptians | 99.7 /100 | #67 | Exceptional 43.3% |
| Immigrants | Indonesia | 99.7 /100 | #68 | Exceptional 43.3% |
| Immigrants | Pakistan | 99.7 /100 | #69 | Exceptional 43.1% |
| Immigrants | Romania | 99.6 /100 | #70 | Exceptional 42.9% |
| Immigrants | Argentina | 99.6 /100 | #71 | Exceptional 42.8% |
| Ethiopians | 99.5 /100 | #72 | Exceptional 42.8% |
| Immigrants | Uzbekistan | 99.5 /100 | #73 | Exceptional 42.8% |
| Bhutanese | 99.5 /100 | #74 | Exceptional 42.7% |
| Immigrants | Zimbabwe | 99.4 /100 | #75 | Exceptional 42.6% |
| Immigrants | Egypt | 99.4 /100 | #76 | Exceptional 42.6% |
| Immigrants | Eastern Europe | 99.4 /100 | #77 | Exceptional 42.5% |
| Immigrants | Ethiopia | 99.4 /100 | #78 | Exceptional 42.5% |
| Immigrants | Lebanon | 99.3 /100 | #79 | Exceptional 42.4% |
| Immigrants | Croatia | 99.2 /100 | #80 | Exceptional 42.3% |
Demographics Similar to Swiss by Bachelor's Degree
In terms of bachelor's degree, the demographic groups most similar to Swiss are Nigerian (37.2%, a difference of 0.020%), Immigrants from Vietnam (37.1%, a difference of 0.22%), Yugoslavian (37.1%, a difference of 0.29%), Slovak (37.3%, a difference of 0.30%), and Immigrants from Oceania (37.3%, a difference of 0.35%).
| Demographics | Rating | Rank | Bachelor's Degree |
| Senegalese | 42.2 /100 | #183 | Average 37.5% |
| Scandinavians | 41.7 /100 | #184 | Average 37.5% |
| Immigrants | Peru | 41.3 /100 | #185 | Average 37.5% |
| Norwegians | 40.4 /100 | #186 | Average 37.5% |
| English | 39.7 /100 | #187 | Fair 37.4% |
| Immigrants | Oceania | 37.3 /100 | #188 | Fair 37.3% |
| Slovaks | 36.9 /100 | #189 | Fair 37.3% |
| Swiss | 34.1 /100 | #190 | Fair 37.2% |
| Nigerians | 33.9 /100 | #191 | Fair 37.2% |
| Immigrants | Vietnam | 32.1 /100 | #192 | Fair 37.1% |
| Yugoslavians | 31.5 /100 | #193 | Fair 37.1% |
| Belgians | 29.9 /100 | #194 | Fair 37.0% |
| Koreans | 29.8 /100 | #195 | Fair 37.0% |
| Celtics | 29.5 /100 | #196 | Fair 37.0% |
| Czechoslovakians | 29.2 /100 | #197 | Fair 37.0% |