Immigrants from Uruguay vs Immigrants from Iraq 6th Grade

COMPARE

Immigrants from Uruguay
Race
Ancestry
AfghanAfricanAlaska NativeAlaskan AthabascanAlbanianAleutAlsatianAmericanApacheArabArapahoArgentineanArmenianAssyrian/Chaldean/SyriacAustralianAustrianBahamianBangladeshiBarbadianBasqueBelgianBelizeanBermudanBhutaneseBlackfeetBolivianBrazilianBritishBritish West IndianBulgarianBurmeseCajunCambodianCanadianCape VerdeanCarpatho RusynCelticCentral AmericanCentral American IndianCherokeeCheyenneChickasawChileanChineseChippewaChoctawColombianColvilleComancheCosta RicanCreeCreekCroatianCrowCubanCypriotCzechCzechoslovakianDanishDelawareDominicanDutchDutch West IndianEastern EuropeanEcuadorianEgyptianEnglishEstonianEthiopianEuropeanFijianFilipinoFinnishFrenchFrench American IndianFrench CanadianGermanGerman RussianGhanaianGreekGuamanian/ChamorroGuatemalanGuyaneseHaitianHmongHonduranHopiHoumaHungarianIcelanderIndian (Asian)IndonesianInupiatIranianIraqiIrishIroquoisIsraeliItalianJamaicanJapaneseJordanianKenyanKiowaKoreanLaotianLatvianLebaneseLiberianLithuanianLumbeeLuxembourgerMacedonianMalaysianMalteseMarshalleseMenomineeMexicanMexican American IndianMongolianMoroccanNative HawaiianNavajoNepaleseNew ZealanderNicaraguanNigerianNorthern EuropeanNorwegianOkinawanOsageOttawaPaiutePakistaniPalestinianPanamanianParaguayanPennsylvania GermanPeruvianPimaPolishPortuguesePotawatomiPuebloPuerto RicanPuget Sound SalishRomanianRussianSalvadoranSamoanScandinavianScotch-IrishScottishSeminoleSenegaleseSerbianShoshoneSierra LeoneanSiouxSlavicSlovakSloveneSomaliSouth AfricanSouth AmericanSouth American IndianSoviet UnionSpaniardSpanishSpanish AmericanSpanish American IndianSri LankanSubsaharan AfricanSudaneseSwedishSwissSyrianTaiwaneseThaiTlingit-HaidaTohono O'OdhamTonganTrinidadian and TobagonianTsimshianTurkishU.S. Virgin IslanderUgandanUkrainianUruguayanUteVenezuelanVietnameseWelshWest IndianYakamaYaquiYugoslavianYumanYup'ikZimbabwean
Immigration
NonimmigrantsImmigrantsAfghanistanAfricaAlbaniaArgentinaArmeniaAsiaAustraliaAustriaBahamasBangladeshBarbadosBelarusBelgiumBelizeBoliviaBosnia and HerzegovinaBrazilBulgariaBurma/MyanmarCabo VerdeCambodiaCameroonCanadaCaribbeanCentral AmericaChileChinaColombiaCongoCosta RicaCroatiaCubaCzechoslovakiaDenmarkDominicaDominican RepublicEastern AfricaEastern AsiaEastern EuropeEcuadorEgyptEl SalvadorEnglandEritreaEthiopiaEuropeFijiFranceGermanyGhanaGreeceGrenadaGuatemalaGuyanaHaitiHondurasHong KongHungaryIndiaIndonesiaIranIrelandIsraelItalyJamaicaJapanJordanKazakhstanKenyaKoreaKuwaitLaosLatin AmericaLatviaLebanonLiberiaLithuaniaMalaysiaMexicoMicronesiaMiddle AfricaMoldovaMoroccoNepalNetherlandsNicaraguaNigeriaNorth AmericaNorth MacedoniaNorthern AfricaNorthern EuropeNorwayOceaniaPakistanPanamaPeruPhilippinesPolandPortugalRomaniaRussiaSaudi ArabiaScotlandSenegalSerbiaSierra LeoneSingaporeSomaliaSouth AfricaSouth AmericaSouth Central AsiaSouth Eastern AsiaSouthern EuropeSpainSri LankaSt. Vincent and the GrenadinesSudanSwedenSwitzerlandSyriaTaiwanThailandTrinidad and TobagoTurkeyUgandaUkraineUruguayUzbekistanVenezuelaVietnamWest IndiesWestern AfricaWestern AsiaWestern EuropeYemenZaireZimbabweAzores
Immigrants from Iraq
Race
Ancestry
AfghanAfricanAlaska NativeAlaskan AthabascanAlbanianAleutAlsatianAmericanApacheArabArapahoArgentineanArmenianAssyrian/Chaldean/SyriacAustralianAustrianBahamianBangladeshiBarbadianBasqueBelgianBelizeanBermudanBhutaneseBlackfeetBolivianBrazilianBritishBritish West IndianBulgarianBurmeseCajunCambodianCanadianCape VerdeanCarpatho RusynCelticCentral AmericanCentral American IndianCherokeeCheyenneChickasawChileanChineseChippewaChoctawColombianColvilleComancheCosta RicanCreeCreekCroatianCrowCubanCypriotCzechCzechoslovakianDanishDelawareDominicanDutchDutch West IndianEastern EuropeanEcuadorianEgyptianEnglishEstonianEthiopianEuropeanFijianFilipinoFinnishFrenchFrench American IndianFrench CanadianGermanGerman RussianGhanaianGreekGuamanian/ChamorroGuatemalanGuyaneseHaitianHmongHonduranHopiHoumaHungarianIcelanderIndian (Asian)IndonesianInupiatIranianIraqiIrishIroquoisIsraeliItalianJamaicanJapaneseJordanianKenyanKiowaKoreanLaotianLatvianLebaneseLiberianLithuanianLumbeeLuxembourgerMacedonianMalaysianMalteseMarshalleseMenomineeMexicanMexican American IndianMongolianMoroccanNative HawaiianNavajoNepaleseNew ZealanderNicaraguanNigerianNorthern EuropeanNorwegianOkinawanOsageOttawaPaiutePakistaniPalestinianPanamanianParaguayanPennsylvania GermanPeruvianPimaPolishPortuguesePotawatomiPuebloPuerto RicanPuget Sound SalishRomanianRussianSalvadoranSamoanScandinavianScotch-IrishScottishSeminoleSenegaleseSerbianShoshoneSierra LeoneanSiouxSlavicSlovakSloveneSomaliSouth AfricanSouth AmericanSouth American IndianSoviet UnionSpaniardSpanishSpanish AmericanSpanish American IndianSri LankanSubsaharan AfricanSudaneseSwedishSwissSyrianTaiwaneseThaiTlingit-HaidaTohono O'OdhamTonganTrinidadian and TobagonianTsimshianTurkishU.S. Virgin IslanderUgandanUkrainianUruguayanUteVenezuelanVietnameseWelshWest IndianYakamaYaquiYugoslavianYumanYup'ikZimbabwean
Immigration
NonimmigrantsImmigrantsAfghanistanAfricaAlbaniaArgentinaArmeniaAsiaAustraliaAustriaBahamasBangladeshBarbadosBelarusBelgiumBelizeBoliviaBosnia and HerzegovinaBrazilBulgariaBurma/MyanmarCabo VerdeCambodiaCameroonCanadaCaribbeanCentral AmericaChileChinaColombiaCongoCosta RicaCroatiaCubaCzechoslovakiaDenmarkDominicaDominican RepublicEastern AfricaEastern AsiaEastern EuropeEcuadorEgyptEl SalvadorEnglandEritreaEthiopiaEuropeFijiFranceGermanyGhanaGreeceGrenadaGuatemalaGuyanaHaitiHondurasHong KongHungaryIndiaIndonesiaIranIraqIrelandIsraelItalyJamaicaJapanJordanKazakhstanKenyaKoreaKuwaitLaosLatin AmericaLatviaLebanonLiberiaLithuaniaMalaysiaMexicoMicronesiaMiddle AfricaMoldovaMoroccoNepalNetherlandsNicaraguaNigeriaNorth AmericaNorth MacedoniaNorthern AfricaNorthern EuropeNorwayOceaniaPakistanPanamaPeruPhilippinesPolandPortugalRomaniaRussiaSaudi ArabiaScotlandSenegalSerbiaSierra LeoneSingaporeSomaliaSouth AfricaSouth AmericaSouth Central AsiaSouth Eastern AsiaSouthern EuropeSpainSri LankaSt. Vincent and the GrenadinesSudanSwedenSwitzerlandSyriaTaiwanThailandTrinidad and TobagoTurkeyUgandaUkraineUzbekistanVenezuelaVietnamWest IndiesWestern AfricaWestern AsiaWestern EuropeYemenZaireZimbabweAzores
6th Grade
Income
Poverty
Unemployment
Labor Participation
Family Structure
Vehicle Availability
Education Level
Disability

6th Grade Comparison

Immigrants from Uruguay

Immigrants from Iraq

Tragic
Tragic
96.5%
6TH GRADE
0.6/ 100
METRIC RATING
252nd/ 347
METRIC RANK
96.8%
6TH GRADE
9.2/ 100
METRIC RATING
211th/ 347
METRIC RANK

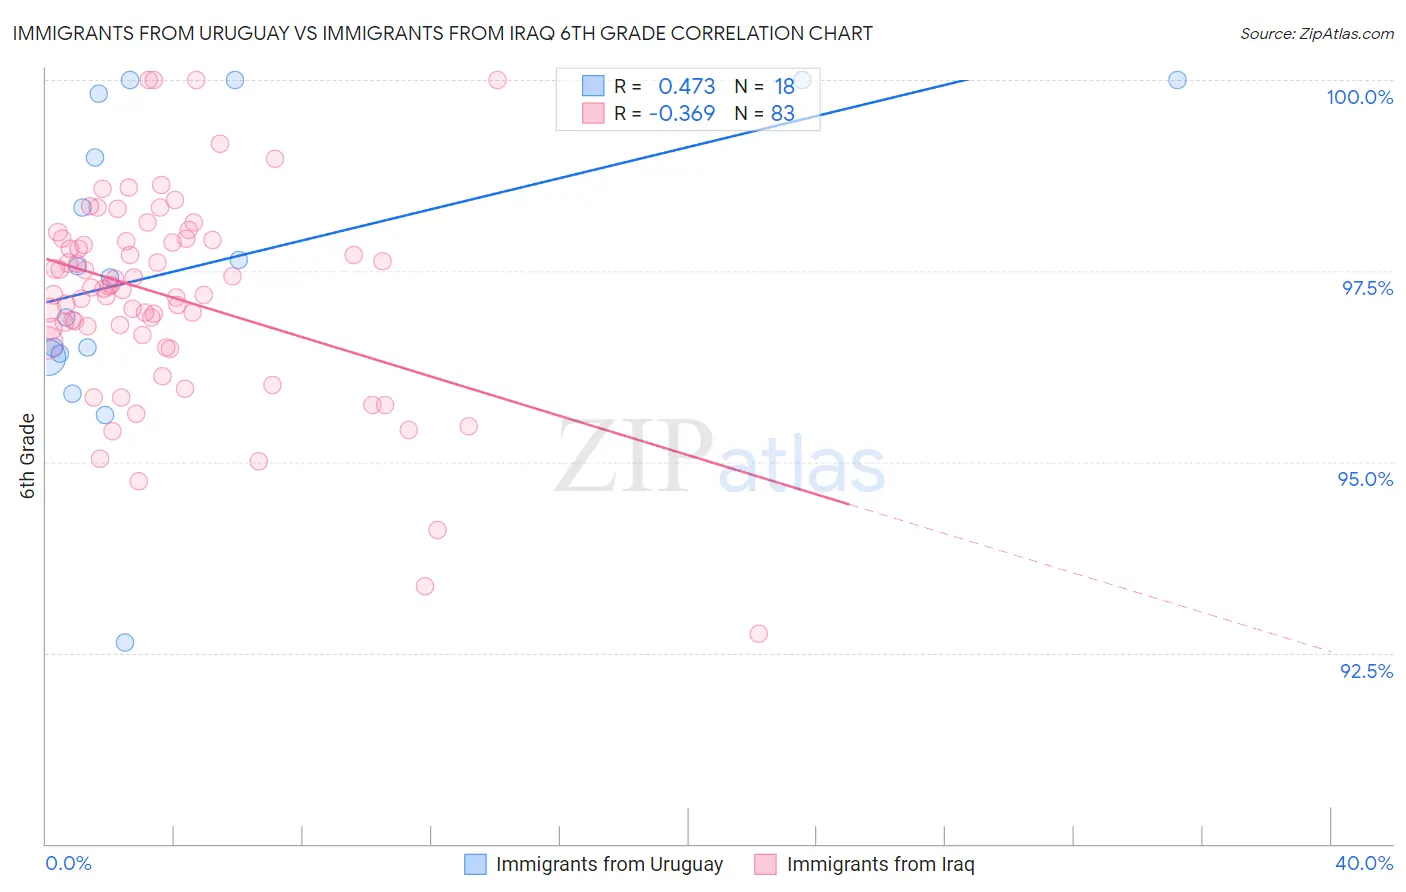
Immigrants from Uruguay vs Immigrants from Iraq 6th Grade Correlation Chart

The statistical analysis conducted on geographies consisting of 133,259,667 people shows a moderate positive correlation between the proportion of Immigrants from Uruguay and percentage of population with at least 6th grade education in the United States with a correlation coefficient (R) of 0.473 and weighted average of 96.5%. Similarly, the statistical analysis conducted on geographies consisting of 194,632,332 people shows a mild negative correlation between the proportion of Immigrants from Iraq and percentage of population with at least 6th grade education in the United States with a correlation coefficient (R) of -0.369 and weighted average of 96.8%, a difference of 0.32%.
Immigrants from Uruguay vs Immigrants from Iraq 6th Grade

6th Grade Correlation Summary

MeasurementImmigrants from UruguayImmigrants from Iraq
Minimum92.6%92.8%
Maximum100.0%100.0%
Range7.4%7.2%
Mean97.6%97.2%
Median97.5%97.3%
Interquartile 25% (IQ1)96.4%96.7%
Interquartile 75% (IQ3)99.8%97.9%
Interquartile Range (IQR)3.4%1.2%
Standard Deviation (Sample)2.0%1.3%
Standard Deviation (Population)1.9%1.3%

Similar Demographics by 6th Grade

Demographics Similar to Immigrants from Uruguay by 6th Grade

In terms of 6th grade, the demographic groups most similar to Immigrants from Uruguay are Immigrants from Senegal (96.5%, a difference of 0.010%), Jamaican (96.5%, a difference of 0.010%), Immigrants from Ethiopia (96.5%, a difference of 0.010%), Immigrants from Congo (96.5%, a difference of 0.010%), and Immigrants from Middle Africa (96.5%, a difference of 0.020%).
DemographicsRating | Rank6th Grade
Immigrants | Costa Rica
1.3
/100
|
#245
Tragic
96.6%
Immigrants | Africa
1.3
/100
|
#246
Tragic
96.6%
Bolivians
1.0
/100
|
#247
Tragic
96.5%
Tohono O'odham
1.0
/100
|
#248
Tragic
96.5%
Colombians
0.9
/100
|
#249
Tragic
96.5%
Immigrants | Middle Africa
0.8
/100
|
#250
Tragic
96.5%
Immigrants | Senegal
0.7
/100
|
#251
Tragic
96.5%
Immigrants | Uruguay
0.6
/100
|
#252
Tragic
96.5%
Jamaicans
0.6
/100
|
#253
Tragic
96.5%
Immigrants | Ethiopia
0.6
/100
|
#254
Tragic
96.5%
Immigrants | Congo
0.6
/100
|
#255
Tragic
96.5%
U.S. Virgin Islanders
0.5
/100
|
#256
Tragic
96.5%
Taiwanese
0.5
/100
|
#257
Tragic
96.5%
Immigrants | China
0.4
/100
|
#258
Tragic
96.4%
South Americans
0.4
/100
|
#259
Tragic
96.4%

Demographics Similar to Immigrants from Iraq by 6th Grade

In terms of 6th grade, the demographic groups most similar to Immigrants from Iraq are Moroccan (96.8%, a difference of 0.0%), Immigrants from Nepal (96.8%, a difference of 0.010%), Immigrants from Sudan (96.8%, a difference of 0.010%), Portuguese (96.8%, a difference of 0.010%), and Samoan (96.8%, a difference of 0.020%).
DemographicsRating | Rank6th Grade
Immigrants | Bahamas
13.8
/100
|
#204
Poor
96.8%
Natives/Alaskans
13.0
/100
|
#205
Poor
96.8%
Laotians
11.8
/100
|
#206
Poor
96.8%
Iraqis
11.7
/100
|
#207
Poor
96.8%
Samoans
11.0
/100
|
#208
Poor
96.8%
Immigrants | Oceania
11.0
/100
|
#209
Poor
96.8%
Immigrants | Nepal
10.1
/100
|
#210
Poor
96.8%
Immigrants | Iraq
9.2
/100
|
#211
Tragic
96.8%
Moroccans
9.0
/100
|
#212
Tragic
96.8%
Immigrants | Sudan
8.7
/100
|
#213
Tragic
96.8%
Portuguese
8.2
/100
|
#214
Tragic
96.8%
Sierra Leoneans
8.0
/100
|
#215
Tragic
96.8%
Paiute
7.8
/100
|
#216
Tragic
96.8%
Liberians
7.5
/100
|
#217
Tragic
96.8%
Navajo
7.3
/100
|
#218
Tragic
96.8%