Immigrants from Uganda vs Iraqi 10th Grade

COMPARE

Immigrants from Uganda
Race
Ancestry
AfghanAfricanAlaska NativeAlaskan AthabascanAlbanianAleutAlsatianAmericanApacheArabArapahoArgentineanArmenianAssyrian/Chaldean/SyriacAustralianAustrianBahamianBangladeshiBarbadianBasqueBelgianBelizeanBermudanBhutaneseBlackfeetBolivianBrazilianBritishBritish West IndianBulgarianBurmeseCajunCambodianCanadianCape VerdeanCarpatho RusynCelticCentral AmericanCentral American IndianCherokeeCheyenneChickasawChileanChineseChippewaChoctawColombianColvilleComancheCosta RicanCreeCreekCroatianCrowCubanCypriotCzechCzechoslovakianDanishDelawareDominicanDutchDutch West IndianEastern EuropeanEcuadorianEgyptianEnglishEstonianEthiopianEuropeanFijianFilipinoFinnishFrenchFrench American IndianFrench CanadianGermanGerman RussianGhanaianGreekGuamanian/ChamorroGuatemalanGuyaneseHaitianHmongHonduranHopiHoumaHungarianIcelanderIndian (Asian)IndonesianInupiatIranianIrishIroquoisIsraeliItalianJamaicanJapaneseJordanianKenyanKiowaKoreanLaotianLatvianLebaneseLiberianLithuanianLumbeeLuxembourgerMacedonianMalaysianMalteseMarshalleseMenomineeMexicanMexican American IndianMongolianMoroccanNative HawaiianNavajoNepaleseNew ZealanderNicaraguanNigerianNorthern EuropeanNorwegianOkinawanOsageOttawaPaiutePakistaniPalestinianPanamanianParaguayanPennsylvania GermanPeruvianPimaPolishPortuguesePotawatomiPuebloPuerto RicanPuget Sound SalishRomanianRussianSalvadoranSamoanScandinavianScotch-IrishScottishSeminoleSenegaleseSerbianShoshoneSierra LeoneanSiouxSlavicSlovakSloveneSomaliSouth AfricanSouth AmericanSouth American IndianSoviet UnionSpaniardSpanishSpanish AmericanSpanish American IndianSri LankanSubsaharan AfricanSudaneseSwedishSwissSyrianTaiwaneseThaiTlingit-HaidaTohono O'OdhamTonganTrinidadian and TobagonianTsimshianTurkishU.S. Virgin IslanderUgandanUkrainianUruguayanUteVenezuelanVietnameseWelshWest IndianYakamaYaquiYugoslavianYumanYup'ikZimbabwean
Immigration
NonimmigrantsImmigrantsAfghanistanAfricaAlbaniaArgentinaArmeniaAsiaAustraliaAustriaBahamasBangladeshBarbadosBelarusBelgiumBelizeBoliviaBosnia and HerzegovinaBrazilBulgariaBurma/MyanmarCabo VerdeCambodiaCameroonCanadaCaribbeanCentral AmericaChileChinaColombiaCongoCosta RicaCroatiaCubaCzechoslovakiaDenmarkDominicaDominican RepublicEastern AfricaEastern AsiaEastern EuropeEcuadorEgyptEl SalvadorEnglandEritreaEthiopiaEuropeFijiFranceGermanyGhanaGreeceGrenadaGuatemalaGuyanaHaitiHondurasHong KongHungaryIndiaIndonesiaIranIraqIrelandIsraelItalyJamaicaJapanJordanKazakhstanKenyaKoreaKuwaitLaosLatin AmericaLatviaLebanonLiberiaLithuaniaMalaysiaMexicoMicronesiaMiddle AfricaMoldovaMoroccoNepalNetherlandsNicaraguaNigeriaNorth AmericaNorth MacedoniaNorthern AfricaNorthern EuropeNorwayOceaniaPakistanPanamaPeruPhilippinesPolandPortugalRomaniaRussiaSaudi ArabiaScotlandSenegalSerbiaSierra LeoneSingaporeSomaliaSouth AfricaSouth AmericaSouth Central AsiaSouth Eastern AsiaSouthern EuropeSpainSri LankaSt. Vincent and the GrenadinesSudanSwedenSwitzerlandSyriaTaiwanThailandTrinidad and TobagoTurkeyUgandaUkraineUruguayUzbekistanVenezuelaVietnamWest IndiesWestern AfricaWestern AsiaWestern EuropeYemenZaireZimbabweAzores
Iraqi
Race
Ancestry
AfghanAfricanAlaska NativeAlaskan AthabascanAlbanianAleutAlsatianAmericanApacheArabArapahoArgentineanArmenianAssyrian/Chaldean/SyriacAustralianAustrianBahamianBangladeshiBarbadianBasqueBelgianBelizeanBermudanBhutaneseBlackfeetBolivianBrazilianBritishBritish West IndianBulgarianBurmeseCajunCambodianCanadianCape VerdeanCarpatho RusynCelticCentral AmericanCentral American IndianCherokeeCheyenneChickasawChileanChineseChippewaChoctawColombianColvilleComancheCosta RicanCreeCreekCroatianCrowCubanCypriotCzechCzechoslovakianDanishDelawareDominicanDutchDutch West IndianEastern EuropeanEcuadorianEgyptianEnglishEstonianEthiopianEuropeanFijianFilipinoFinnishFrenchFrench American IndianFrench CanadianGermanGerman RussianGhanaianGreekGuamanian/ChamorroGuatemalanGuyaneseHaitianHmongHonduranHopiHoumaHungarianIcelanderIndian (Asian)IndonesianInupiatIranianIraqiIrishIroquoisIsraeliItalianJamaicanJapaneseJordanianKenyanKiowaKoreanLaotianLatvianLebaneseLiberianLithuanianLumbeeLuxembourgerMacedonianMalaysianMalteseMarshalleseMenomineeMexicanMexican American IndianMongolianMoroccanNative HawaiianNavajoNepaleseNew ZealanderNicaraguanNigerianNorthern EuropeanNorwegianOkinawanOsageOttawaPaiutePakistaniPalestinianPanamanianParaguayanPennsylvania GermanPeruvianPimaPolishPortuguesePotawatomiPuebloPuerto RicanPuget Sound SalishRomanianRussianSalvadoranSamoanScandinavianScotch-IrishScottishSeminoleSenegaleseSerbianShoshoneSierra LeoneanSiouxSlavicSlovakSloveneSomaliSouth AfricanSouth AmericanSouth American IndianSoviet UnionSpaniardSpanishSpanish AmericanSpanish American IndianSri LankanSubsaharan AfricanSudaneseSwedishSwissSyrianTaiwaneseThaiTlingit-HaidaTohono O'OdhamTonganTrinidadian and TobagonianTsimshianTurkishU.S. Virgin IslanderUgandanUkrainianUruguayanUteVenezuelanVietnameseWelshWest IndianYakamaYaquiYugoslavianYumanYup'ikZimbabwean
Immigration
NonimmigrantsImmigrantsAfghanistanAfricaAlbaniaArgentinaArmeniaAsiaAustraliaAustriaBahamasBangladeshBarbadosBelarusBelgiumBelizeBoliviaBosnia and HerzegovinaBrazilBulgariaBurma/MyanmarCabo VerdeCambodiaCameroonCanadaCaribbeanCentral AmericaChileChinaColombiaCongoCosta RicaCroatiaCubaCzechoslovakiaDenmarkDominicaDominican RepublicEastern AfricaEastern AsiaEastern EuropeEcuadorEgyptEl SalvadorEnglandEritreaEthiopiaEuropeFijiFranceGermanyGhanaGreeceGrenadaGuatemalaGuyanaHaitiHondurasHong KongHungaryIndiaIndonesiaIranIraqIrelandIsraelItalyJamaicaJapanJordanKazakhstanKenyaKoreaKuwaitLaosLatin AmericaLatviaLebanonLiberiaLithuaniaMalaysiaMexicoMicronesiaMiddle AfricaMoldovaMoroccoNepalNetherlandsNicaraguaNigeriaNorth AmericaNorth MacedoniaNorthern AfricaNorthern EuropeNorwayOceaniaPakistanPanamaPeruPhilippinesPolandPortugalRomaniaRussiaSaudi ArabiaScotlandSenegalSerbiaSierra LeoneSingaporeSomaliaSouth AfricaSouth AmericaSouth Central AsiaSouth Eastern AsiaSouthern EuropeSpainSri LankaSt. Vincent and the GrenadinesSudanSwedenSwitzerlandSyriaTaiwanThailandTrinidad and TobagoTurkeyUkraineUruguayUzbekistanVenezuelaVietnamWest IndiesWestern AfricaWestern AsiaWestern EuropeYemenZaireZimbabweAzores
10th Grade
Income
Poverty
Unemployment
Labor Participation
Family Structure
Vehicle Availability
Education Level
Disability

10th Grade Comparison

Immigrants from Uganda

Iraqis

Fair
Good
93.5%
10TH GRADE
20.9/ 100
METRIC RATING
202nd/ 347
METRIC RANK
93.9%
10TH GRADE
68.1/ 100
METRIC RATING
164th/ 347
METRIC RANK

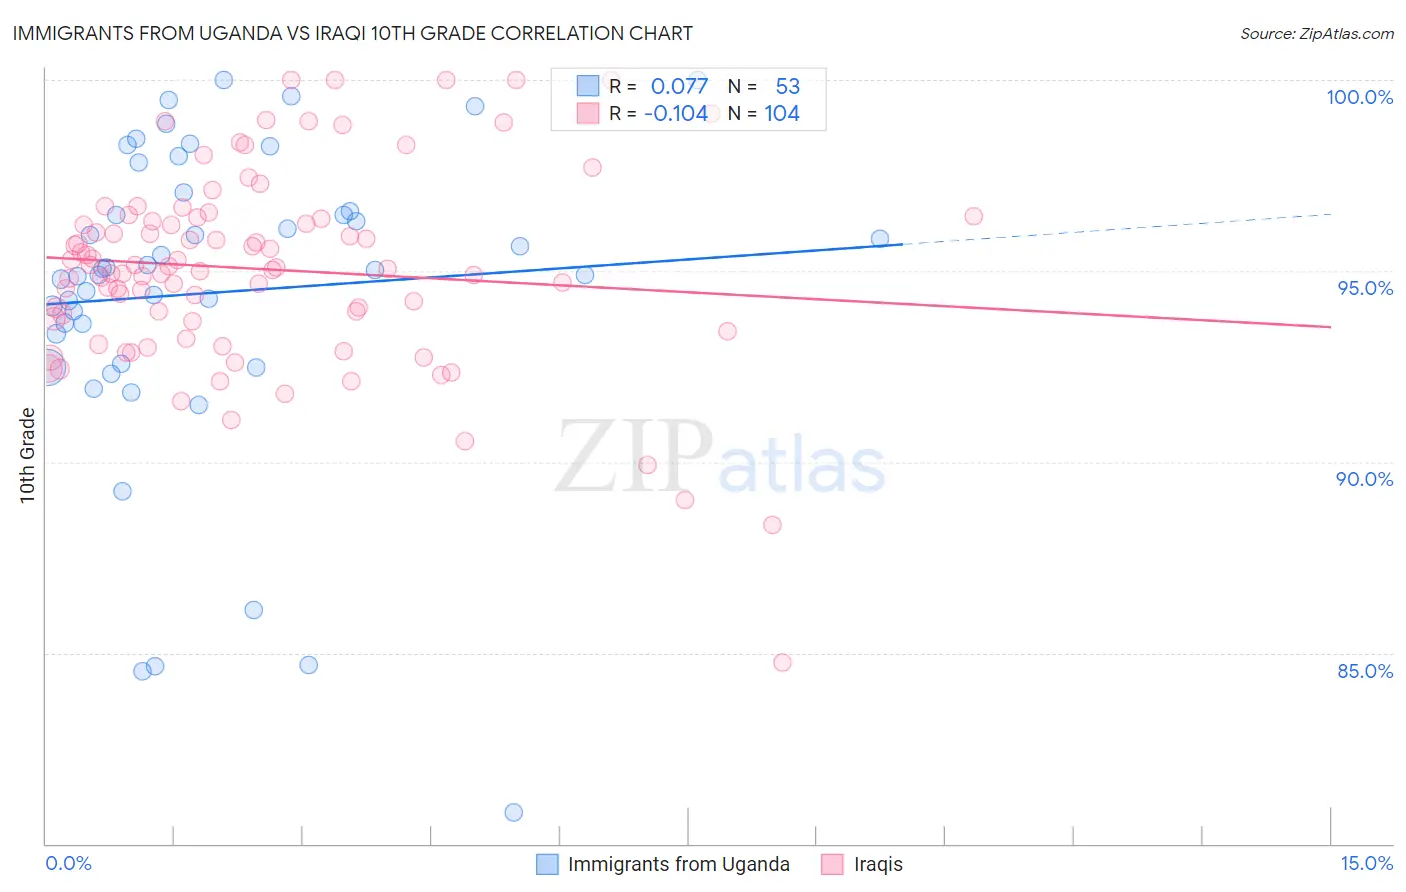
Immigrants from Uganda vs Iraqi 10th Grade Correlation Chart

The statistical analysis conducted on geographies consisting of 125,970,180 people shows a slight positive correlation between the proportion of Immigrants from Uganda and percentage of population with at least 10th grade education in the United States with a correlation coefficient (R) of 0.077 and weighted average of 93.5%. Similarly, the statistical analysis conducted on geographies consisting of 170,595,168 people shows a poor negative correlation between the proportion of Iraqis and percentage of population with at least 10th grade education in the United States with a correlation coefficient (R) of -0.104 and weighted average of 93.9%, a difference of 0.47%.
Immigrants from Uganda vs Iraqi 10th Grade

10th Grade Correlation Summary

MeasurementImmigrants from UgandaIraqi
Minimum80.8%84.7%
Maximum100.0%100.0%
Range19.2%15.3%
Mean94.4%95.0%
Median95.0%95.1%
Interquartile 25% (IQ1)93.0%93.7%
Interquartile 75% (IQ3)96.8%96.4%
Interquartile Range (IQR)3.8%2.7%
Standard Deviation (Sample)4.1%2.6%
Standard Deviation (Population)4.1%2.6%

Similar Demographics by 10th Grade

Demographics Similar to Immigrants from Uganda by 10th Grade

In terms of 10th grade, the demographic groups most similar to Immigrants from Uganda are Hawaiian (93.5%, a difference of 0.010%), Immigrants from Western Asia (93.4%, a difference of 0.010%), Ute (93.4%, a difference of 0.010%), Immigrants from Indonesia (93.4%, a difference of 0.010%), and Immigrants from Sudan (93.4%, a difference of 0.010%).
DemographicsRating | Rank10th Grade
Cheyenne
26.8
/100
|
#195
Fair
93.5%
Moroccans
25.3
/100
|
#196
Fair
93.5%
Pueblo
23.9
/100
|
#197
Fair
93.5%
Immigrants | Micronesia
23.2
/100
|
#198
Fair
93.5%
Asians
23.0
/100
|
#199
Fair
93.5%
Hopi
22.2
/100
|
#200
Fair
93.5%
Hawaiians
21.8
/100
|
#201
Fair
93.5%
Immigrants | Uganda
20.9
/100
|
#202
Fair
93.5%
Immigrants | Western Asia
20.6
/100
|
#203
Fair
93.4%
Ute
20.3
/100
|
#204
Fair
93.4%
Immigrants | Indonesia
20.2
/100
|
#205
Fair
93.4%
Immigrants | Sudan
20.0
/100
|
#206
Fair
93.4%
Samoans
19.5
/100
|
#207
Poor
93.4%
Immigrants | Syria
19.4
/100
|
#208
Poor
93.4%
Immigrants | Chile
18.8
/100
|
#209
Poor
93.4%

Demographics Similar to Iraqis by 10th Grade

In terms of 10th grade, the demographic groups most similar to Iraqis are Venezuelan (93.9%, a difference of 0.010%), Chilean (93.9%, a difference of 0.020%), Pakistani (93.9%, a difference of 0.020%), Assyrian/Chaldean/Syriac (93.9%, a difference of 0.020%), and Immigrants from Poland (93.9%, a difference of 0.020%).
DemographicsRating | Rank10th Grade
Kiowa
73.3
/100
|
#157
Good
93.9%
Bermudans
71.0
/100
|
#158
Good
93.9%
Chileans
70.2
/100
|
#159
Good
93.9%
Pakistanis
70.1
/100
|
#160
Good
93.9%
Assyrians/Chaldeans/Syriacs
69.7
/100
|
#161
Good
93.9%
Immigrants | Poland
69.6
/100
|
#162
Good
93.9%
Venezuelans
69.5
/100
|
#163
Good
93.9%
Iraqis
68.1
/100
|
#164
Good
93.9%
Brazilians
63.6
/100
|
#165
Good
93.8%
Immigrants | Iraq
63.0
/100
|
#166
Good
93.8%
Immigrants | Egypt
62.3
/100
|
#167
Good
93.8%
Alsatians
59.4
/100
|
#168
Average
93.8%
Immigrants | Spain
55.9
/100
|
#169
Average
93.8%
Immigrants | Venezuela
53.9
/100
|
#170
Average
93.8%
Immigrants | Albania
52.4
/100
|
#171
Average
93.8%