Immigrants from Uganda vs Immigrants from Burma/Myanmar 7th Grade

COMPARE

Immigrants from Uganda
Race
Ancestry
AfghanAfricanAlaska NativeAlaskan AthabascanAlbanianAleutAlsatianAmericanApacheArabArapahoArgentineanArmenianAssyrian/Chaldean/SyriacAustralianAustrianBahamianBangladeshiBarbadianBasqueBelgianBelizeanBermudanBhutaneseBlackfeetBolivianBrazilianBritishBritish West IndianBulgarianBurmeseCajunCambodianCanadianCape VerdeanCarpatho RusynCelticCentral AmericanCentral American IndianCherokeeCheyenneChickasawChileanChineseChippewaChoctawColombianColvilleComancheCosta RicanCreeCreekCroatianCrowCubanCypriotCzechCzechoslovakianDanishDelawareDominicanDutchDutch West IndianEastern EuropeanEcuadorianEgyptianEnglishEstonianEthiopianEuropeanFijianFilipinoFinnishFrenchFrench American IndianFrench CanadianGermanGerman RussianGhanaianGreekGuamanian/ChamorroGuatemalanGuyaneseHaitianHmongHonduranHopiHoumaHungarianIcelanderIndian (Asian)IndonesianInupiatIranianIraqiIrishIroquoisIsraeliItalianJamaicanJapaneseJordanianKenyanKiowaKoreanLaotianLatvianLebaneseLiberianLithuanianLumbeeLuxembourgerMacedonianMalaysianMalteseMarshalleseMenomineeMexicanMexican American IndianMongolianMoroccanNative HawaiianNavajoNepaleseNew ZealanderNicaraguanNigerianNorthern EuropeanNorwegianOkinawanOsageOttawaPaiutePakistaniPalestinianPanamanianParaguayanPennsylvania GermanPeruvianPimaPolishPortuguesePotawatomiPuebloPuerto RicanPuget Sound SalishRomanianRussianSalvadoranSamoanScandinavianScotch-IrishScottishSeminoleSenegaleseSerbianShoshoneSierra LeoneanSiouxSlavicSlovakSloveneSomaliSouth AfricanSouth AmericanSouth American IndianSoviet UnionSpaniardSpanishSpanish AmericanSpanish American IndianSri LankanSubsaharan AfricanSudaneseSwedishSwissSyrianTaiwaneseThaiTlingit-HaidaTohono O'OdhamTonganTrinidadian and TobagonianTsimshianTurkishU.S. Virgin IslanderUgandanUkrainianUruguayanUteVenezuelanVietnameseWelshWest IndianYakamaYaquiYugoslavianYumanYup'ikZimbabwean
Immigration
NonimmigrantsImmigrantsAfghanistanAfricaAlbaniaArgentinaArmeniaAsiaAustraliaAustriaBahamasBangladeshBarbadosBelarusBelgiumBelizeBoliviaBosnia and HerzegovinaBrazilBulgariaCabo VerdeCambodiaCameroonCanadaCaribbeanCentral AmericaChileChinaColombiaCongoCosta RicaCroatiaCubaCzechoslovakiaDenmarkDominicaDominican RepublicEastern AfricaEastern AsiaEastern EuropeEcuadorEgyptEl SalvadorEnglandEritreaEthiopiaEuropeFijiFranceGermanyGhanaGreeceGrenadaGuatemalaGuyanaHaitiHondurasHong KongHungaryIndiaIndonesiaIranIraqIrelandIsraelItalyJamaicaJapanJordanKazakhstanKenyaKoreaKuwaitLaosLatin AmericaLatviaLebanonLiberiaLithuaniaMalaysiaMexicoMicronesiaMiddle AfricaMoldovaMoroccoNepalNetherlandsNicaraguaNigeriaNorth AmericaNorth MacedoniaNorthern AfricaNorthern EuropeNorwayOceaniaPakistanPanamaPeruPhilippinesPolandPortugalRomaniaRussiaSaudi ArabiaScotlandSenegalSerbiaSierra LeoneSingaporeSomaliaSouth AfricaSouth AmericaSouth Central AsiaSouth Eastern AsiaSouthern EuropeSpainSri LankaSt. Vincent and the GrenadinesSudanSwedenSwitzerlandSyriaTaiwanThailandTrinidad and TobagoTurkeyUgandaUkraineUruguayUzbekistanVenezuelaVietnamWest IndiesWestern AfricaWestern AsiaWestern EuropeYemenZaireZimbabweAzores
Immigrants from Burma/Myanmar
Race
Ancestry
AfghanAfricanAlaska NativeAlaskan AthabascanAlbanianAleutAlsatianAmericanApacheArabArapahoArgentineanArmenianAssyrian/Chaldean/SyriacAustralianAustrianBahamianBangladeshiBarbadianBasqueBelgianBelizeanBermudanBhutaneseBlackfeetBolivianBrazilianBritishBritish West IndianBulgarianBurmeseCajunCambodianCanadianCape VerdeanCarpatho RusynCelticCentral AmericanCentral American IndianCherokeeCheyenneChickasawChileanChineseChippewaChoctawColombianColvilleComancheCosta RicanCreeCreekCroatianCrowCubanCypriotCzechCzechoslovakianDanishDelawareDominicanDutchDutch West IndianEastern EuropeanEcuadorianEgyptianEnglishEstonianEthiopianEuropeanFijianFilipinoFinnishFrenchFrench American IndianFrench CanadianGermanGerman RussianGhanaianGreekGuamanian/ChamorroGuatemalanGuyaneseHaitianHmongHonduranHopiHoumaHungarianIcelanderIndian (Asian)IndonesianInupiatIranianIraqiIrishIroquoisIsraeliItalianJamaicanJapaneseJordanianKenyanKiowaKoreanLaotianLatvianLebaneseLiberianLithuanianLumbeeLuxembourgerMacedonianMalaysianMalteseMarshalleseMenomineeMexicanMexican American IndianMongolianMoroccanNative HawaiianNavajoNepaleseNew ZealanderNicaraguanNigerianNorthern EuropeanNorwegianOkinawanOsageOttawaPaiutePakistaniPalestinianPanamanianParaguayanPennsylvania GermanPeruvianPimaPolishPortuguesePotawatomiPuebloPuerto RicanPuget Sound SalishRomanianRussianSalvadoranSamoanScandinavianScotch-IrishScottishSeminoleSenegaleseSerbianShoshoneSierra LeoneanSiouxSlavicSlovakSloveneSomaliSouth AfricanSouth AmericanSouth American IndianSoviet UnionSpaniardSpanishSpanish AmericanSpanish American IndianSri LankanSubsaharan AfricanSudaneseSwedishSwissSyrianTaiwaneseThaiTlingit-HaidaTohono O'OdhamTonganTrinidadian and TobagonianTsimshianTurkishU.S. Virgin IslanderUgandanUkrainianUruguayanUteVenezuelanVietnameseWelshWest IndianYakamaYaquiYugoslavianYumanYup'ikZimbabwean
Immigration
NonimmigrantsImmigrantsAfghanistanAfricaAlbaniaArgentinaArmeniaAsiaAustraliaAustriaBahamasBangladeshBarbadosBelarusBelgiumBelizeBoliviaBosnia and HerzegovinaBrazilBulgariaBurma/MyanmarCabo VerdeCambodiaCameroonCanadaCaribbeanCentral AmericaChileChinaColombiaCongoCosta RicaCroatiaCubaCzechoslovakiaDenmarkDominicaDominican RepublicEastern AfricaEastern AsiaEastern EuropeEcuadorEgyptEl SalvadorEnglandEritreaEthiopiaEuropeFijiFranceGermanyGhanaGreeceGrenadaGuatemalaGuyanaHaitiHondurasHong KongHungaryIndiaIndonesiaIranIraqIrelandIsraelItalyJamaicaJapanJordanKazakhstanKenyaKoreaKuwaitLaosLatin AmericaLatviaLebanonLiberiaLithuaniaMalaysiaMexicoMicronesiaMiddle AfricaMoldovaMoroccoNepalNetherlandsNicaraguaNigeriaNorth AmericaNorth MacedoniaNorthern AfricaNorthern EuropeNorwayOceaniaPakistanPanamaPeruPhilippinesPolandPortugalRomaniaRussiaSaudi ArabiaScotlandSenegalSerbiaSierra LeoneSingaporeSomaliaSouth AfricaSouth AmericaSouth Central AsiaSouth Eastern AsiaSouthern EuropeSpainSri LankaSt. Vincent and the GrenadinesSudanSwedenSwitzerlandSyriaTaiwanThailandTrinidad and TobagoTurkeyUkraineUruguayUzbekistanVenezuelaVietnamWest IndiesWestern AfricaWestern AsiaWestern EuropeYemenZaireZimbabweAzores
7th Grade
Income
Poverty
Unemployment
Labor Participation
Family Structure
Vehicle Availability
Education Level
Disability

7th Grade Comparison

Immigrants from Uganda

Immigrants from Burma/Myanmar

Fair
Tragic
96.0%
7TH GRADE
36.0/ 100
METRIC RATING
187th/ 347
METRIC RANK
94.5%
7TH GRADE
0.0/ 100
METRIC RATING
300th/ 347
METRIC RANK

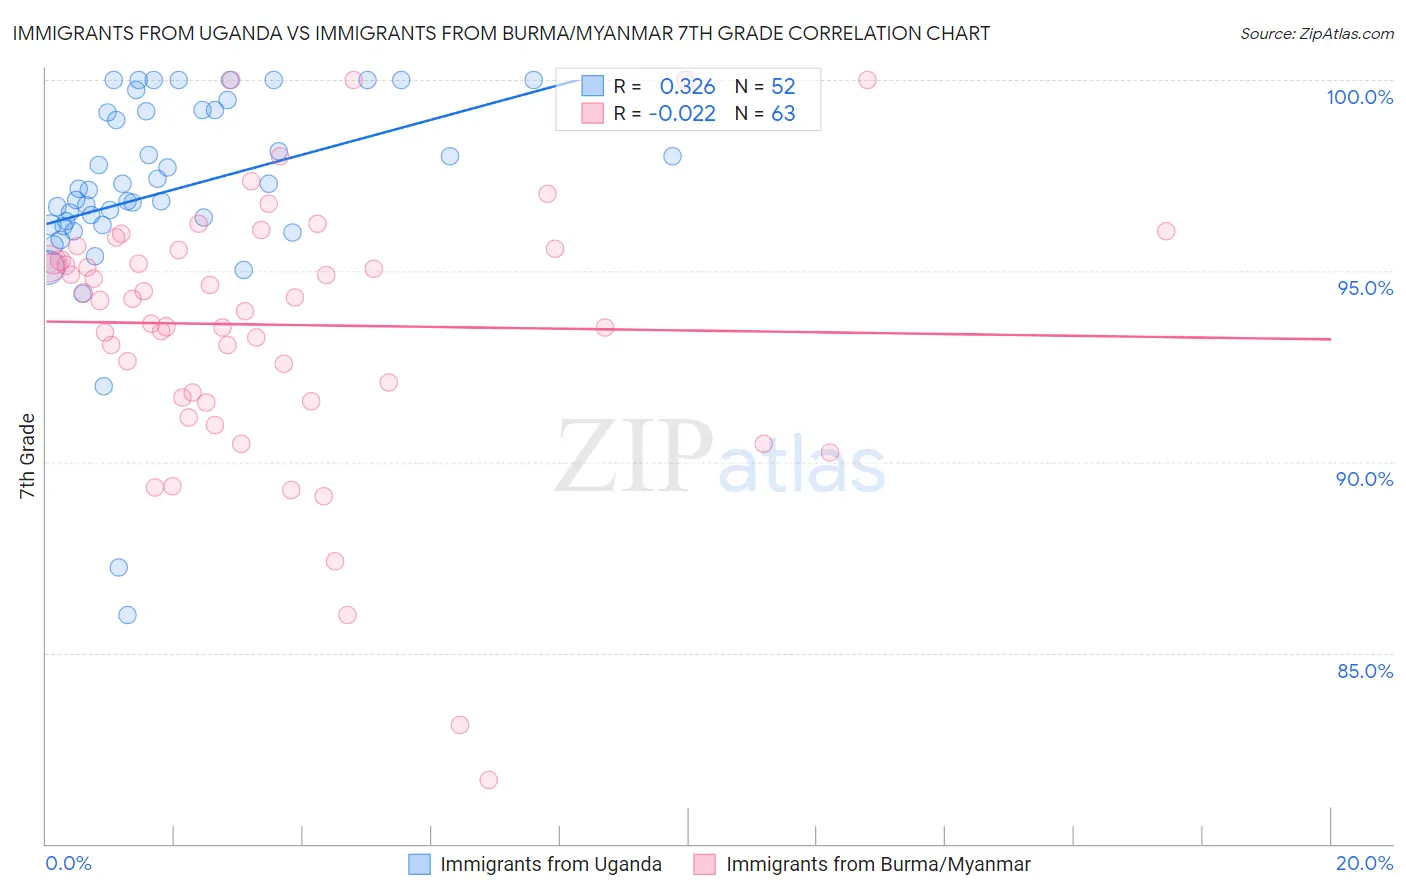
Immigrants from Uganda vs Immigrants from Burma/Myanmar 7th Grade Correlation Chart

The statistical analysis conducted on geographies consisting of 125,943,496 people shows a mild positive correlation between the proportion of Immigrants from Uganda and percentage of population with at least 7th grade education in the United States with a correlation coefficient (R) of 0.326 and weighted average of 96.0%. Similarly, the statistical analysis conducted on geographies consisting of 172,345,696 people shows no correlation between the proportion of Immigrants from Burma/Myanmar and percentage of population with at least 7th grade education in the United States with a correlation coefficient (R) of -0.022 and weighted average of 94.5%, a difference of 1.5%.
Immigrants from Uganda vs Immigrants from Burma/Myanmar 7th Grade

7th Grade Correlation Summary

MeasurementImmigrants from UgandaImmigrants from Burma/Myanmar
Minimum86.0%81.7%
Maximum100.0%100.0%
Range14.0%18.3%
Mean97.1%93.6%
Median97.1%94.3%
Interquartile 25% (IQ1)96.2%91.7%
Interquartile 75% (IQ3)99.2%95.6%
Interquartile Range (IQR)3.0%3.9%
Standard Deviation (Sample)2.8%3.6%
Standard Deviation (Population)2.7%3.5%

Similar Demographics by 7th Grade

Demographics Similar to Immigrants from Uganda by 7th Grade

In terms of 7th grade, the demographic groups most similar to Immigrants from Uganda are Immigrants from Iraq (96.0%, a difference of 0.0%), Sierra Leonean (96.0%, a difference of 0.010%), Brazilian (96.0%, a difference of 0.010%), Immigrants from Egypt (95.9%, a difference of 0.010%), and Immigrants from Venezuela (95.9%, a difference of 0.010%).
DemographicsRating | Rank7th Grade
Immigrants | Brazil
46.8
/100
|
#180
Average
96.0%
Pakistanis
44.5
/100
|
#181
Average
96.0%
Iraqis
41.2
/100
|
#182
Average
96.0%
Immigrants | Spain
38.8
/100
|
#183
Fair
96.0%
Sierra Leoneans
37.5
/100
|
#184
Fair
96.0%
Brazilians
37.3
/100
|
#185
Fair
96.0%
Immigrants | Iraq
36.1
/100
|
#186
Fair
96.0%
Immigrants | Uganda
36.0
/100
|
#187
Fair
96.0%
Immigrants | Egypt
34.3
/100
|
#188
Fair
95.9%
Immigrants | Venezuela
33.9
/100
|
#189
Fair
95.9%
Immigrants | Micronesia
32.6
/100
|
#190
Fair
95.9%
Liberians
32.5
/100
|
#191
Fair
95.9%
Panamanians
32.3
/100
|
#192
Fair
95.9%
Immigrants | Bahamas
30.8
/100
|
#193
Fair
95.9%
Immigrants | Nepal
30.0
/100
|
#194
Fair
95.9%

Demographics Similar to Immigrants from Burma/Myanmar by 7th Grade

In terms of 7th grade, the demographic groups most similar to Immigrants from Burma/Myanmar are Immigrants from Dominica (94.5%, a difference of 0.030%), Immigrants from Laos (94.5%, a difference of 0.030%), Immigrants from South Eastern Asia (94.5%, a difference of 0.040%), Indonesian (94.5%, a difference of 0.040%), and Bangladeshi (94.5%, a difference of 0.040%).
DemographicsRating | Rank7th Grade
Fijians
0.0
/100
|
#293
Tragic
94.7%
Haitians
0.0
/100
|
#294
Tragic
94.7%
Yaqui
0.0
/100
|
#295
Tragic
94.6%
Cubans
0.0
/100
|
#296
Tragic
94.6%
Immigrants | South Eastern Asia
0.0
/100
|
#297
Tragic
94.5%
Indonesians
0.0
/100
|
#298
Tragic
94.5%
Bangladeshis
0.0
/100
|
#299
Tragic
94.5%
Immigrants | Burma/Myanmar
0.0
/100
|
#300
Tragic
94.5%
Immigrants | Dominica
0.0
/100
|
#301
Tragic
94.5%
Immigrants | Laos
0.0
/100
|
#302
Tragic
94.5%
Sri Lankans
0.0
/100
|
#303
Tragic
94.4%
Immigrants | Haiti
0.0
/100
|
#304
Tragic
94.3%
Guyanese
0.0
/100
|
#305
Tragic
94.3%
Immigrants | Guyana
0.0
/100
|
#306
Tragic
94.2%
Immigrants | Portugal
0.0
/100
|
#307
Tragic
94.2%