Immigrants from Taiwan vs Eastern European 8th Grade

COMPARE

Immigrants from Taiwan
Race
Ancestry
AfghanAfricanAlaska NativeAlaskan AthabascanAlbanianAleutAlsatianAmericanApacheArabArapahoArgentineanArmenianAssyrian/Chaldean/SyriacAustralianAustrianBahamianBangladeshiBarbadianBasqueBelgianBelizeanBermudanBhutaneseBlackfeetBolivianBrazilianBritishBritish West IndianBulgarianBurmeseCajunCambodianCanadianCape VerdeanCarpatho RusynCelticCentral AmericanCentral American IndianCherokeeCheyenneChickasawChileanChineseChippewaChoctawColombianColvilleComancheCosta RicanCreeCreekCroatianCrowCubanCypriotCzechCzechoslovakianDanishDelawareDominicanDutchDutch West IndianEcuadorianEgyptianEnglishEstonianEthiopianEuropeanFijianFilipinoFinnishFrenchFrench American IndianFrench CanadianGermanGerman RussianGhanaianGreekGuamanian/ChamorroGuatemalanGuyaneseHaitianHmongHonduranHopiHoumaHungarianIcelanderIndian (Asian)IndonesianInupiatIranianIraqiIrishIroquoisIsraeliItalianJamaicanJapaneseJordanianKenyanKiowaKoreanLaotianLatvianLebaneseLiberianLithuanianLumbeeLuxembourgerMacedonianMalaysianMalteseMarshalleseMenomineeMexicanMexican American IndianMongolianMoroccanNative HawaiianNavajoNepaleseNew ZealanderNicaraguanNigerianNorthern EuropeanNorwegianOkinawanOsageOttawaPaiutePakistaniPalestinianPanamanianParaguayanPennsylvania GermanPeruvianPimaPolishPortuguesePotawatomiPuebloPuerto RicanPuget Sound SalishRomanianRussianSalvadoranSamoanScandinavianScotch-IrishScottishSeminoleSenegaleseSerbianShoshoneSierra LeoneanSiouxSlavicSlovakSloveneSomaliSouth AfricanSouth AmericanSouth American IndianSoviet UnionSpaniardSpanishSpanish AmericanSpanish American IndianSri LankanSubsaharan AfricanSudaneseSwedishSwissSyrianTaiwaneseThaiTlingit-HaidaTohono O'OdhamTonganTrinidadian and TobagonianTsimshianTurkishU.S. Virgin IslanderUgandanUkrainianUruguayanUteVenezuelanVietnameseWelshWest IndianYakamaYaquiYugoslavianYumanYup'ikZimbabwean
Immigration
NonimmigrantsImmigrantsAfghanistanAfricaAlbaniaArgentinaArmeniaAsiaAustraliaAustriaBahamasBangladeshBarbadosBelarusBelgiumBelizeBoliviaBosnia and HerzegovinaBrazilBulgariaBurma/MyanmarCabo VerdeCambodiaCameroonCanadaCaribbeanCentral AmericaChileChinaColombiaCongoCosta RicaCroatiaCubaCzechoslovakiaDenmarkDominicaDominican RepublicEastern AfricaEastern AsiaEastern EuropeEcuadorEgyptEl SalvadorEnglandEritreaEthiopiaEuropeFijiFranceGermanyGhanaGreeceGrenadaGuatemalaGuyanaHaitiHondurasHong KongHungaryIndiaIndonesiaIranIraqIrelandIsraelItalyJamaicaJapanJordanKazakhstanKenyaKoreaKuwaitLaosLatin AmericaLatviaLebanonLiberiaLithuaniaMalaysiaMexicoMicronesiaMiddle AfricaMoldovaMoroccoNepalNetherlandsNicaraguaNigeriaNorth AmericaNorth MacedoniaNorthern AfricaNorthern EuropeNorwayOceaniaPakistanPanamaPeruPhilippinesPolandPortugalRomaniaRussiaSaudi ArabiaScotlandSenegalSerbiaSierra LeoneSingaporeSomaliaSouth AfricaSouth AmericaSouth Central AsiaSouth Eastern AsiaSouthern EuropeSpainSri LankaSt. Vincent and the GrenadinesSudanSwedenSwitzerlandSyriaTaiwanThailandTrinidad and TobagoTurkeyUgandaUkraineUruguayUzbekistanVenezuelaVietnamWest IndiesWestern AfricaWestern AsiaWestern EuropeYemenZaireZimbabweAzores
Eastern European
Race
Ancestry
AfghanAfricanAlaska NativeAlaskan AthabascanAlbanianAleutAlsatianAmericanApacheArabArapahoArgentineanArmenianAssyrian/Chaldean/SyriacAustralianAustrianBahamianBangladeshiBarbadianBasqueBelgianBelizeanBermudanBhutaneseBlackfeetBolivianBrazilianBritishBritish West IndianBulgarianBurmeseCajunCambodianCanadianCape VerdeanCarpatho RusynCelticCentral AmericanCentral American IndianCherokeeCheyenneChickasawChileanChineseChippewaChoctawColombianColvilleComancheCosta RicanCreeCreekCroatianCrowCubanCypriotCzechCzechoslovakianDanishDelawareDominicanDutchDutch West IndianEastern EuropeanEcuadorianEgyptianEnglishEstonianEthiopianEuropeanFijianFilipinoFinnishFrenchFrench American IndianFrench CanadianGermanGerman RussianGhanaianGreekGuamanian/ChamorroGuatemalanGuyaneseHaitianHmongHonduranHopiHoumaHungarianIcelanderIndian (Asian)IndonesianInupiatIranianIraqiIrishIroquoisIsraeliItalianJamaicanJapaneseJordanianKenyanKiowaKoreanLaotianLatvianLebaneseLiberianLithuanianLumbeeLuxembourgerMacedonianMalaysianMalteseMarshalleseMenomineeMexicanMexican American IndianMongolianMoroccanNative HawaiianNavajoNepaleseNew ZealanderNicaraguanNigerianNorthern EuropeanNorwegianOkinawanOsageOttawaPaiutePakistaniPalestinianPanamanianParaguayanPennsylvania GermanPeruvianPimaPolishPortuguesePotawatomiPuebloPuerto RicanPuget Sound SalishRomanianRussianSalvadoranSamoanScandinavianScotch-IrishScottishSeminoleSenegaleseSerbianShoshoneSierra LeoneanSiouxSlavicSlovakSloveneSomaliSouth AfricanSouth AmericanSouth American IndianSoviet UnionSpaniardSpanishSpanish AmericanSpanish American IndianSri LankanSubsaharan AfricanSudaneseSwedishSwissSyrianTaiwaneseThaiTlingit-HaidaTohono O'OdhamTonganTrinidadian and TobagonianTsimshianTurkishU.S. Virgin IslanderUgandanUkrainianUruguayanUteVenezuelanVietnameseWelshWest IndianYakamaYaquiYugoslavianYumanYup'ikZimbabwean
Immigration
NonimmigrantsImmigrantsAfghanistanAfricaAlbaniaArgentinaArmeniaAsiaAustraliaAustriaBahamasBangladeshBarbadosBelarusBelgiumBelizeBoliviaBosnia and HerzegovinaBrazilBulgariaBurma/MyanmarCabo VerdeCambodiaCameroonCanadaCaribbeanCentral AmericaChileChinaColombiaCongoCosta RicaCroatiaCubaCzechoslovakiaDenmarkDominicaDominican RepublicEastern AfricaEastern AsiaEastern EuropeEcuadorEgyptEl SalvadorEnglandEritreaEthiopiaEuropeFijiFranceGermanyGhanaGreeceGrenadaGuatemalaGuyanaHaitiHondurasHong KongHungaryIndiaIndonesiaIranIraqIrelandIsraelItalyJamaicaJapanJordanKazakhstanKenyaKoreaKuwaitLaosLatin AmericaLatviaLebanonLiberiaLithuaniaMalaysiaMexicoMicronesiaMiddle AfricaMoldovaMoroccoNepalNetherlandsNicaraguaNigeriaNorth AmericaNorth MacedoniaNorthern AfricaNorthern EuropeNorwayOceaniaPakistanPanamaPeruPhilippinesPolandPortugalRomaniaRussiaSaudi ArabiaScotlandSenegalSerbiaSierra LeoneSingaporeSomaliaSouth AfricaSouth AmericaSouth Central AsiaSouth Eastern AsiaSouthern EuropeSpainSri LankaSt. Vincent and the GrenadinesSudanSwedenSwitzerlandSyriaThailandTrinidad and TobagoTurkeyUgandaUkraineUruguayUzbekistanVenezuelaVietnamWest IndiesWestern AfricaWestern AsiaWestern EuropeYemenZaireZimbabweAzores
8th Grade
Income
Poverty
Unemployment
Labor Participation
Family Structure
Vehicle Availability
Education Level
Disability

8th Grade Comparison

Immigrants from Taiwan

Eastern Europeans

Good
Exceptional
95.9%
8TH GRADE
70.5/ 100
METRIC RATING
157th/ 347
METRIC RANK
97.0%
8TH GRADE
100.0/ 100
METRIC RATING
41st/ 347
METRIC RANK

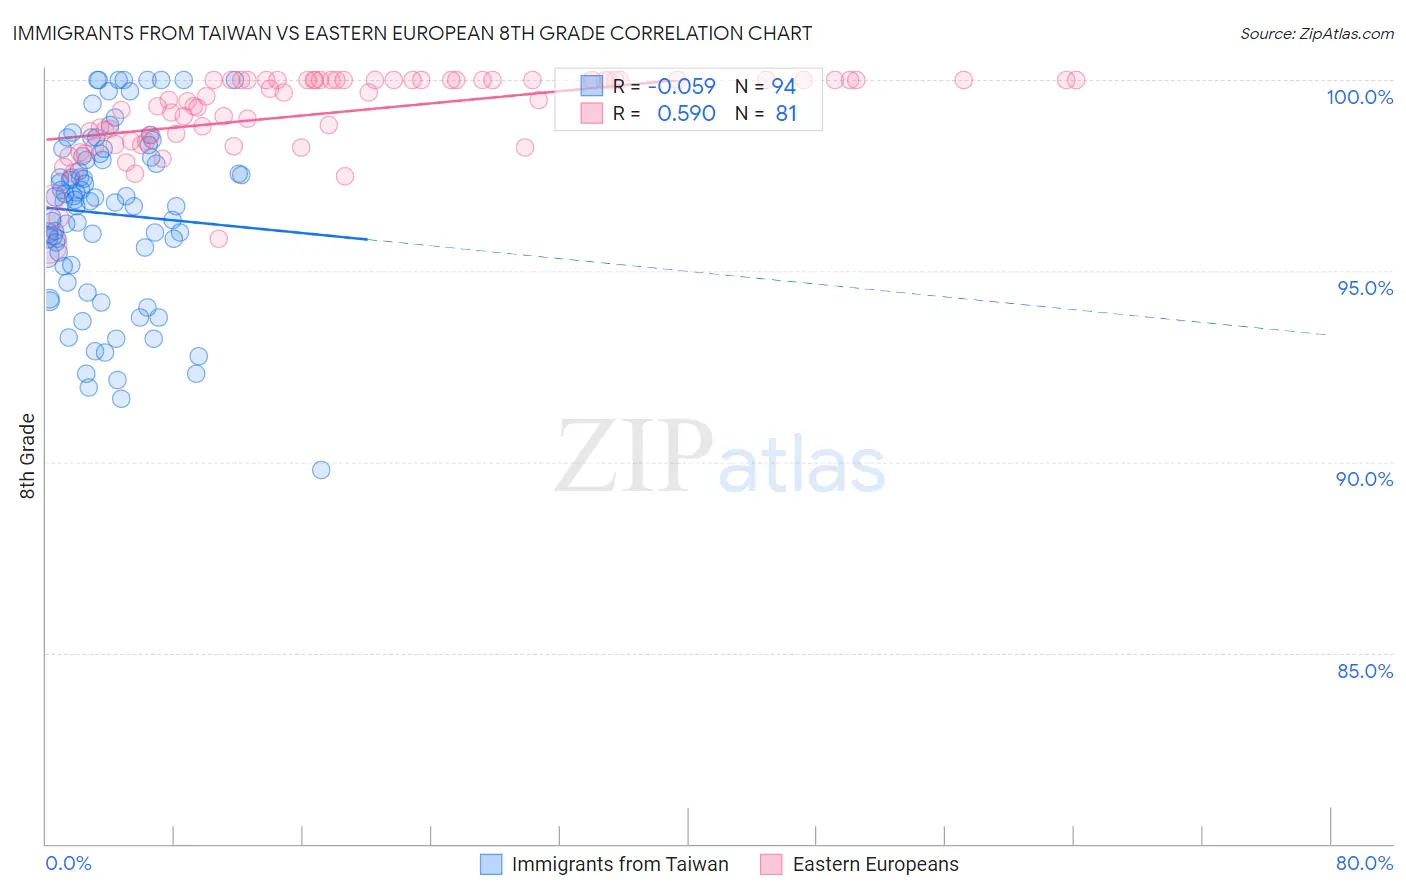
Immigrants from Taiwan vs Eastern European 8th Grade Correlation Chart

The statistical analysis conducted on geographies consisting of 298,069,199 people shows a slight negative correlation between the proportion of Immigrants from Taiwan and percentage of population with at least 8th grade education in the United States with a correlation coefficient (R) of -0.059 and weighted average of 95.9%. Similarly, the statistical analysis conducted on geographies consisting of 461,247,443 people shows a substantial positive correlation between the proportion of Eastern Europeans and percentage of population with at least 8th grade education in the United States with a correlation coefficient (R) of 0.590 and weighted average of 97.0%, a difference of 1.1%.
Immigrants from Taiwan vs Eastern European 8th Grade

8th Grade Correlation Summary

MeasurementImmigrants from TaiwanEastern European
Minimum89.8%95.7%
Maximum100.0%100.0%
Range10.2%4.3%
Mean96.5%99.2%
Median96.8%99.6%
Interquartile 25% (IQ1)95.4%98.4%
Interquartile 75% (IQ3)98.0%100.0%
Interquartile Range (IQR)2.6%1.6%
Standard Deviation (Sample)2.3%1.0%
Standard Deviation (Population)2.2%1.0%

Similar Demographics by 8th Grade

Demographics Similar to Immigrants from Taiwan by 8th Grade

In terms of 8th grade, the demographic groups most similar to Immigrants from Taiwan are Arab (95.9%, a difference of 0.010%), Immigrants from Kazakhstan (95.9%, a difference of 0.020%), Seminole (95.8%, a difference of 0.020%), Bermudan (95.8%, a difference of 0.020%), and Kenyan (95.9%, a difference of 0.030%).
DemographicsRating | Rank8th Grade
Immigrants | Russia
80.9
/100
|
#150
Excellent
96.0%
Blackfeet
80.8
/100
|
#151
Excellent
96.0%
French American Indians
80.6
/100
|
#152
Excellent
96.0%
Immigrants | Jordan
79.5
/100
|
#153
Good
95.9%
Hopi
79.4
/100
|
#154
Good
95.9%
Kenyans
74.5
/100
|
#155
Good
95.9%
Ugandans
74.1
/100
|
#156
Good
95.9%
Immigrants | Taiwan
70.5
/100
|
#157
Good
95.9%
Arabs
69.4
/100
|
#158
Good
95.9%
Immigrants | Kazakhstan
68.4
/100
|
#159
Good
95.9%
Seminole
67.7
/100
|
#160
Good
95.8%
Bermudans
67.5
/100
|
#161
Good
95.8%
Immigrants | Kenya
67.2
/100
|
#162
Good
95.8%
Immigrants | Sri Lanka
64.1
/100
|
#163
Good
95.8%
Immigrants | Italy
63.5
/100
|
#164
Good
95.8%

Demographics Similar to Eastern Europeans by 8th Grade

In terms of 8th grade, the demographic groups most similar to Eastern Europeans are Inupiat (97.0%, a difference of 0.0%), British (97.0%, a difference of 0.020%), Hungarian (97.0%, a difference of 0.020%), Belgian (97.0%, a difference of 0.040%), and Latvian (97.0%, a difference of 0.040%).
DemographicsRating | Rank8th Grade
Luxembourgers
100.0
/100
|
#34
Exceptional
97.0%
Alaska Natives
100.0
/100
|
#35
Exceptional
97.0%
Belgians
100.0
/100
|
#36
Exceptional
97.0%
Latvians
100.0
/100
|
#37
Exceptional
97.0%
British
100.0
/100
|
#38
Exceptional
97.0%
Hungarians
100.0
/100
|
#39
Exceptional
97.0%
Inupiat
100.0
/100
|
#40
Exceptional
97.0%
Eastern Europeans
100.0
/100
|
#41
Exceptional
97.0%
Chinese
100.0
/100
|
#42
Exceptional
96.9%
Aleuts
99.9
/100
|
#43
Exceptional
96.9%
Maltese
99.9
/100
|
#44
Exceptional
96.9%
Northern Europeans
99.9
/100
|
#45
Exceptional
96.9%
Czechoslovakians
99.9
/100
|
#46
Exceptional
96.9%
Bulgarians
99.9
/100
|
#47
Exceptional
96.9%
Slavs
99.9
/100
|
#48
Exceptional
96.8%