Immigrants from Syria vs Immigrants from Ukraine Nursery School
COMPARE
Immigrants from Syria
Immigrants from Ukraine
Nursery School
Nursery School Comparison
Immigrants from Syria
Immigrants from Ukraine
97.7%
NURSERY SCHOOL
4.0/ 100
METRIC RATING
222nd/ 347
METRIC RANK
97.9%
NURSERY SCHOOL
19.9/ 100
METRIC RATING
202nd/ 347
METRIC RANK
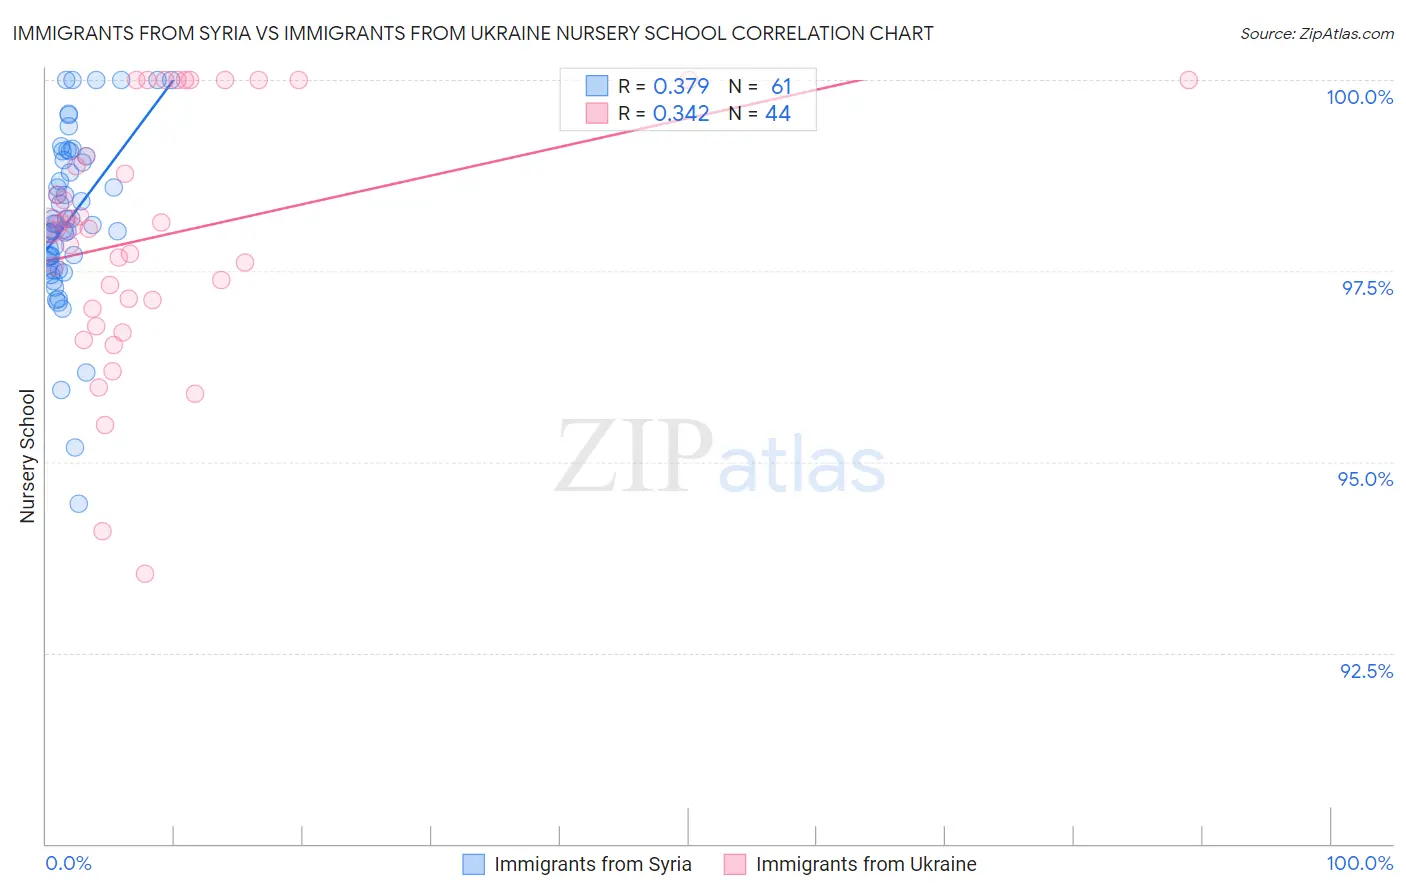
Immigrants from Syria vs Immigrants from Ukraine Nursery School Correlation Chart
The statistical analysis conducted on geographies consisting of 174,108,882 people shows a mild positive correlation between the proportion of Immigrants from Syria and percentage of population with at least nursery school education in the United States with a correlation coefficient (R) of 0.379 and weighted average of 97.7%. Similarly, the statistical analysis conducted on geographies consisting of 289,712,791 people shows a mild positive correlation between the proportion of Immigrants from Ukraine and percentage of population with at least nursery school education in the United States with a correlation coefficient (R) of 0.342 and weighted average of 97.9%, a difference of 0.13%.
Nursery School Correlation Summary
| Measurement | Immigrants from Syria | Immigrants from Ukraine |
| Minimum | 94.4% | 93.5% |
| Maximum | 100.0% | 100.0% |
| Range | 5.6% | 6.5% |
| Mean | 98.2% | 98.0% |
| Median | 98.1% | 98.1% |
| Interquartile 25% (IQ1) | 97.6% | 97.1% |
| Interquartile 75% (IQ3) | 99.0% | 99.5% |
| Interquartile Range (IQR) | 1.4% | 2.4% |
| Standard Deviation (Sample) | 1.1% | 1.6% |
| Standard Deviation (Population) | 1.1% | 1.6% |
Demographics Similar to Immigrants from Syria and Immigrants from Ukraine by Nursery School
In terms of nursery school, the demographic groups most similar to Immigrants from Syria are Immigrants from Zaire (97.8%, a difference of 0.010%), Tongan (97.8%, a difference of 0.010%), Immigrants from Panama (97.8%, a difference of 0.020%), Immigrants from Morocco (97.8%, a difference of 0.020%), and Samoan (97.8%, a difference of 0.040%). Similarly, the demographic groups most similar to Immigrants from Ukraine are Immigrants from Uganda (97.9%, a difference of 0.010%), Immigrants from Southern Europe (97.9%, a difference of 0.010%), Immigrants from Chile (97.9%, a difference of 0.010%), Immigrants from Albania (97.9%, a difference of 0.020%), and African (97.9%, a difference of 0.020%).
| Demographics | Rating | Rank | Nursery School |
| Immigrants | Ukraine | 19.9 /100 | #202 | Poor 97.9% |
| Immigrants | Uganda | 18.0 /100 | #203 | Poor 97.9% |
| Immigrants | Southern Europe | 17.4 /100 | #204 | Poor 97.9% |
| Immigrants | Chile | 17.3 /100 | #205 | Poor 97.9% |
| Immigrants | Albania | 16.4 /100 | #206 | Poor 97.9% |
| Africans | 15.4 /100 | #207 | Poor 97.9% |
| Immigrants | Northern Africa | 11.7 /100 | #208 | Poor 97.8% |
| Costa Ricans | 11.3 /100 | #209 | Poor 97.8% |
| Immigrants | Oceania | 10.2 /100 | #210 | Poor 97.8% |
| Laotians | 9.8 /100 | #211 | Tragic 97.8% |
| Immigrants | Bahamas | 8.6 /100 | #212 | Tragic 97.8% |
| Moroccans | 8.3 /100 | #213 | Tragic 97.8% |
| South American Indians | 8.0 /100 | #214 | Tragic 97.8% |
| Bahamians | 7.4 /100 | #215 | Tragic 97.8% |
| Uruguayans | 7.1 /100 | #216 | Tragic 97.8% |
| Samoans | 6.3 /100 | #217 | Tragic 97.8% |
| Immigrants | Panama | 5.3 /100 | #218 | Tragic 97.8% |
| Immigrants | Morocco | 5.1 /100 | #219 | Tragic 97.8% |
| Immigrants | Zaire | 4.4 /100 | #220 | Tragic 97.8% |
| Tongans | 4.3 /100 | #221 | Tragic 97.8% |
| Immigrants | Syria | 4.0 /100 | #222 | Tragic 97.7% |