Immigrants from Syria vs Immigrants from Guyana 6th Grade

COMPARE

Immigrants from Syria
Race
Ancestry
AfghanAfricanAlaska NativeAlaskan AthabascanAlbanianAleutAlsatianAmericanApacheArabArapahoArgentineanArmenianAssyrian/Chaldean/SyriacAustralianAustrianBahamianBangladeshiBarbadianBasqueBelgianBelizeanBermudanBhutaneseBlackfeetBolivianBrazilianBritishBritish West IndianBulgarianBurmeseCajunCambodianCanadianCape VerdeanCarpatho RusynCelticCentral AmericanCentral American IndianCherokeeCheyenneChickasawChileanChineseChippewaChoctawColombianColvilleComancheCosta RicanCreeCreekCroatianCrowCubanCypriotCzechCzechoslovakianDanishDelawareDominicanDutchDutch West IndianEastern EuropeanEcuadorianEgyptianEnglishEstonianEthiopianEuropeanFijianFilipinoFinnishFrenchFrench American IndianFrench CanadianGermanGerman RussianGhanaianGreekGuamanian/ChamorroGuatemalanGuyaneseHaitianHmongHonduranHopiHoumaHungarianIcelanderIndian (Asian)IndonesianInupiatIranianIraqiIrishIroquoisIsraeliItalianJamaicanJapaneseJordanianKenyanKiowaKoreanLaotianLatvianLebaneseLiberianLithuanianLumbeeLuxembourgerMacedonianMalaysianMalteseMarshalleseMenomineeMexicanMexican American IndianMongolianMoroccanNative HawaiianNavajoNepaleseNew ZealanderNicaraguanNigerianNorthern EuropeanNorwegianOkinawanOsageOttawaPaiutePakistaniPalestinianPanamanianParaguayanPennsylvania GermanPeruvianPimaPolishPortuguesePotawatomiPuebloPuerto RicanPuget Sound SalishRomanianRussianSalvadoranSamoanScandinavianScotch-IrishScottishSeminoleSenegaleseSerbianShoshoneSierra LeoneanSiouxSlavicSlovakSloveneSomaliSouth AfricanSouth AmericanSouth American IndianSoviet UnionSpaniardSpanishSpanish AmericanSpanish American IndianSri LankanSubsaharan AfricanSudaneseSwedishSwissSyrianTaiwaneseThaiTlingit-HaidaTohono O'OdhamTonganTrinidadian and TobagonianTsimshianTurkishU.S. Virgin IslanderUgandanUkrainianUruguayanUteVenezuelanVietnameseWelshWest IndianYakamaYaquiYugoslavianYumanYup'ikZimbabwean
Immigration
NonimmigrantsImmigrantsAfghanistanAfricaAlbaniaArgentinaArmeniaAsiaAustraliaAustriaBahamasBangladeshBarbadosBelarusBelgiumBelizeBoliviaBosnia and HerzegovinaBrazilBulgariaBurma/MyanmarCabo VerdeCambodiaCameroonCanadaCaribbeanCentral AmericaChileChinaColombiaCongoCosta RicaCroatiaCubaCzechoslovakiaDenmarkDominicaDominican RepublicEastern AfricaEastern AsiaEastern EuropeEcuadorEgyptEl SalvadorEnglandEritreaEthiopiaEuropeFijiFranceGermanyGhanaGreeceGrenadaGuatemalaHaitiHondurasHong KongHungaryIndiaIndonesiaIranIraqIrelandIsraelItalyJamaicaJapanJordanKazakhstanKenyaKoreaKuwaitLaosLatin AmericaLatviaLebanonLiberiaLithuaniaMalaysiaMexicoMicronesiaMiddle AfricaMoldovaMoroccoNepalNetherlandsNicaraguaNigeriaNorth AmericaNorth MacedoniaNorthern AfricaNorthern EuropeNorwayOceaniaPakistanPanamaPeruPhilippinesPolandPortugalRomaniaRussiaSaudi ArabiaScotlandSenegalSerbiaSierra LeoneSingaporeSomaliaSouth AfricaSouth AmericaSouth Central AsiaSouth Eastern AsiaSouthern EuropeSpainSri LankaSt. Vincent and the GrenadinesSudanSwedenSwitzerlandSyriaTaiwanThailandTrinidad and TobagoTurkeyUgandaUkraineUruguayUzbekistanVenezuelaVietnamWest IndiesWestern AfricaWestern AsiaWestern EuropeYemenZaireZimbabweAzores
Immigrants from Guyana
Race
Ancestry
AfghanAfricanAlaska NativeAlaskan AthabascanAlbanianAleutAlsatianAmericanApacheArabArapahoArgentineanArmenianAssyrian/Chaldean/SyriacAustralianAustrianBahamianBangladeshiBarbadianBasqueBelgianBelizeanBermudanBhutaneseBlackfeetBolivianBrazilianBritishBritish West IndianBulgarianBurmeseCajunCambodianCanadianCape VerdeanCarpatho RusynCelticCentral AmericanCentral American IndianCherokeeCheyenneChickasawChileanChineseChippewaChoctawColombianColvilleComancheCosta RicanCreeCreekCroatianCrowCubanCypriotCzechCzechoslovakianDanishDelawareDominicanDutchDutch West IndianEastern EuropeanEcuadorianEgyptianEnglishEstonianEthiopianEuropeanFijianFilipinoFinnishFrenchFrench American IndianFrench CanadianGermanGerman RussianGhanaianGreekGuamanian/ChamorroGuatemalanGuyaneseHaitianHmongHonduranHopiHoumaHungarianIcelanderIndian (Asian)IndonesianInupiatIranianIraqiIrishIroquoisIsraeliItalianJamaicanJapaneseJordanianKenyanKiowaKoreanLaotianLatvianLebaneseLiberianLithuanianLumbeeLuxembourgerMacedonianMalaysianMalteseMarshalleseMenomineeMexicanMexican American IndianMongolianMoroccanNative HawaiianNavajoNepaleseNew ZealanderNicaraguanNigerianNorthern EuropeanNorwegianOkinawanOsageOttawaPaiutePakistaniPalestinianPanamanianParaguayanPennsylvania GermanPeruvianPimaPolishPortuguesePotawatomiPuebloPuerto RicanPuget Sound SalishRomanianRussianSalvadoranSamoanScandinavianScotch-IrishScottishSeminoleSenegaleseSerbianShoshoneSierra LeoneanSiouxSlavicSlovakSloveneSomaliSouth AfricanSouth AmericanSouth American IndianSoviet UnionSpaniardSpanishSpanish AmericanSpanish American IndianSri LankanSubsaharan AfricanSudaneseSwedishSwissSyrianTaiwaneseThaiTlingit-HaidaTohono O'OdhamTonganTrinidadian and TobagonianTsimshianTurkishU.S. Virgin IslanderUgandanUkrainianUruguayanUteVenezuelanVietnameseWelshWest IndianYakamaYaquiYugoslavianYumanYup'ikZimbabwean
Immigration
NonimmigrantsImmigrantsAfghanistanAfricaAlbaniaArgentinaArmeniaAsiaAustraliaAustriaBahamasBangladeshBarbadosBelarusBelgiumBelizeBoliviaBosnia and HerzegovinaBrazilBulgariaBurma/MyanmarCabo VerdeCambodiaCameroonCanadaCaribbeanCentral AmericaChileChinaColombiaCongoCosta RicaCroatiaCubaCzechoslovakiaDenmarkDominicaDominican RepublicEastern AfricaEastern AsiaEastern EuropeEcuadorEgyptEl SalvadorEnglandEritreaEthiopiaEuropeFijiFranceGermanyGhanaGreeceGrenadaGuatemalaGuyanaHaitiHondurasHong KongHungaryIndiaIndonesiaIranIraqIrelandIsraelItalyJamaicaJapanJordanKazakhstanKenyaKoreaKuwaitLaosLatin AmericaLatviaLebanonLiberiaLithuaniaMalaysiaMexicoMicronesiaMiddle AfricaMoldovaMoroccoNepalNetherlandsNicaraguaNigeriaNorth AmericaNorth MacedoniaNorthern AfricaNorthern EuropeNorwayOceaniaPakistanPanamaPeruPhilippinesPolandPortugalRomaniaRussiaSaudi ArabiaScotlandSenegalSerbiaSierra LeoneSingaporeSomaliaSouth AfricaSouth AmericaSouth Central AsiaSouth Eastern AsiaSouthern EuropeSpainSri LankaSt. Vincent and the GrenadinesSudanSwedenSwitzerlandTaiwanThailandTrinidad and TobagoTurkeyUgandaUkraineUruguayUzbekistanVenezuelaVietnamWest IndiesWestern AfricaWestern AsiaWestern EuropeYemenZaireZimbabweAzores
6th Grade
Income
Poverty
Unemployment
Labor Participation
Family Structure
Vehicle Availability
Education Level
Disability

6th Grade Comparison

Immigrants from Syria

Immigrants from Guyana

Tragic
Tragic
96.7%
6TH GRADE
5.9/ 100
METRIC RATING
222nd/ 347
METRIC RANK
95.5%
6TH GRADE
0.0/ 100
METRIC RATING
312th/ 347
METRIC RANK

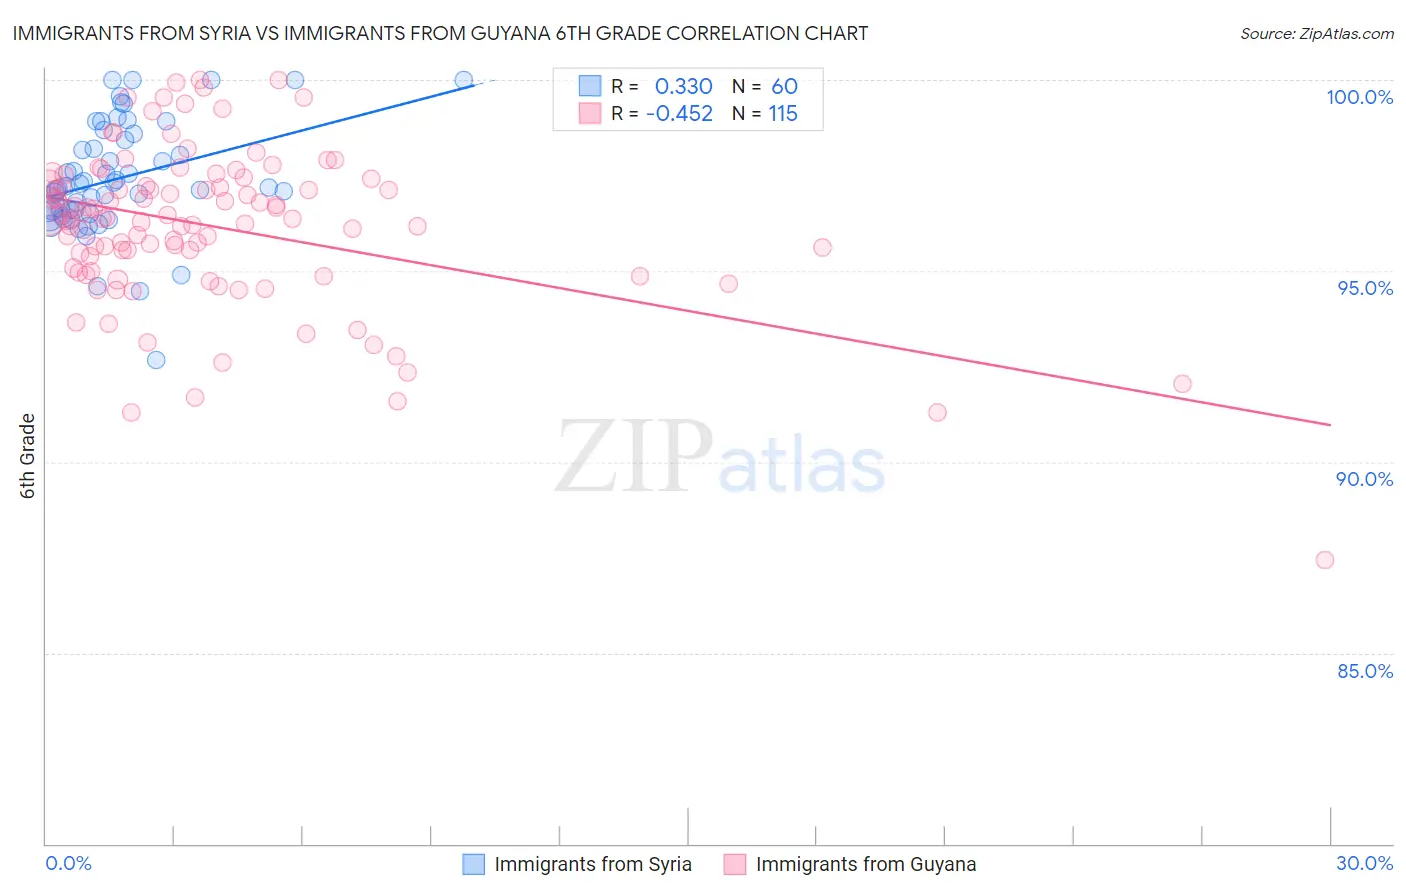
Immigrants from Syria vs Immigrants from Guyana 6th Grade Correlation Chart

The statistical analysis conducted on geographies consisting of 174,108,374 people shows a mild positive correlation between the proportion of Immigrants from Syria and percentage of population with at least 6th grade education in the United States with a correlation coefficient (R) of 0.330 and weighted average of 96.7%. Similarly, the statistical analysis conducted on geographies consisting of 183,673,461 people shows a moderate negative correlation between the proportion of Immigrants from Guyana and percentage of population with at least 6th grade education in the United States with a correlation coefficient (R) of -0.452 and weighted average of 95.5%, a difference of 1.3%.
Immigrants from Syria vs Immigrants from Guyana 6th Grade

6th Grade Correlation Summary

MeasurementImmigrants from SyriaImmigrants from Guyana
Minimum92.7%87.4%
Maximum100.0%100.0%
Range7.3%12.6%
Mean97.4%96.2%
Median97.2%96.4%
Interquartile 25% (IQ1)96.5%95.0%
Interquartile 75% (IQ3)98.5%97.3%
Interquartile Range (IQR)2.0%2.3%
Standard Deviation (Sample)1.5%2.1%
Standard Deviation (Population)1.5%2.1%

Similar Demographics by 6th Grade

Demographics Similar to Immigrants from Syria by 6th Grade

In terms of 6th grade, the demographic groups most similar to Immigrants from Syria are Tongan (96.7%, a difference of 0.0%), Immigrants from Morocco (96.7%, a difference of 0.010%), Costa Rican (96.8%, a difference of 0.020%), Liberian (96.8%, a difference of 0.030%), and Navajo (96.8%, a difference of 0.030%).
DemographicsRating | Rank6th Grade
Sierra Leoneans
8.0
/100
|
#215
Tragic
96.8%
Paiute
7.8
/100
|
#216
Tragic
96.8%
Liberians
7.5
/100
|
#217
Tragic
96.8%
Navajo
7.3
/100
|
#218
Tragic
96.8%
Costa Ricans
6.8
/100
|
#219
Tragic
96.8%
Immigrants | Morocco
6.2
/100
|
#220
Tragic
96.7%
Tongans
6.1
/100
|
#221
Tragic
96.7%
Immigrants | Syria
5.9
/100
|
#222
Tragic
96.7%
Bahamians
4.8
/100
|
#223
Tragic
96.7%
Immigrants | Southern Europe
4.4
/100
|
#224
Tragic
96.7%
Immigrants | Pakistan
4.4
/100
|
#225
Tragic
96.7%
Immigrants | Panama
4.2
/100
|
#226
Tragic
96.7%
Immigrants | Western Asia
4.1
/100
|
#227
Tragic
96.7%
Immigrants | Malaysia
4.0
/100
|
#228
Tragic
96.7%
Assyrians/Chaldeans/Syriacs
4.0
/100
|
#229
Tragic
96.7%

Demographics Similar to Immigrants from Guyana by 6th Grade

In terms of 6th grade, the demographic groups most similar to Immigrants from Guyana are Immigrants from Portugal (95.5%, a difference of 0.010%), Ecuadorian (95.5%, a difference of 0.030%), Puerto Rican (95.5%, a difference of 0.040%), Immigrants from Caribbean (95.6%, a difference of 0.090%), and Nicaraguan (95.4%, a difference of 0.090%).
DemographicsRating | Rank6th Grade
Immigrants | Cuba
0.0
/100
|
#305
Tragic
95.6%
Immigrants | Haiti
0.0
/100
|
#306
Tragic
95.6%
Guyanese
0.0
/100
|
#307
Tragic
95.6%
Immigrants | Caribbean
0.0
/100
|
#308
Tragic
95.6%
Puerto Ricans
0.0
/100
|
#309
Tragic
95.5%
Ecuadorians
0.0
/100
|
#310
Tragic
95.5%
Immigrants | Portugal
0.0
/100
|
#311
Tragic
95.5%
Immigrants | Guyana
0.0
/100
|
#312
Tragic
95.5%
Nicaraguans
0.0
/100
|
#313
Tragic
95.4%
Immigrants | Vietnam
0.0
/100
|
#314
Tragic
95.4%
Immigrants | Bangladesh
0.0
/100
|
#315
Tragic
95.4%
Japanese
0.0
/100
|
#316
Tragic
95.4%
Vietnamese
0.0
/100
|
#317
Tragic
95.3%
Belizeans
0.0
/100
|
#318
Tragic
95.3%
Immigrants | Belize
0.0
/100
|
#319
Tragic
95.3%