Immigrants from Sweden vs Ethiopian Associate's Degree

COMPARE

Immigrants from Sweden
Race
Ancestry
AfghanAfricanAlaska NativeAlaskan AthabascanAlbanianAleutAlsatianAmericanApacheArabArapahoArgentineanArmenianAssyrian/Chaldean/SyriacAustralianAustrianBahamianBangladeshiBarbadianBasqueBelgianBelizeanBermudanBhutaneseBlackfeetBolivianBrazilianBritishBritish West IndianBulgarianBurmeseCajunCambodianCanadianCape VerdeanCarpatho RusynCelticCentral AmericanCentral American IndianCherokeeCheyenneChickasawChileanChineseChippewaChoctawColombianColvilleComancheCosta RicanCreeCreekCroatianCrowCubanCypriotCzechCzechoslovakianDanishDelawareDominicanDutchDutch West IndianEastern EuropeanEcuadorianEgyptianEnglishEstonianEuropeanFijianFilipinoFinnishFrenchFrench American IndianFrench CanadianGermanGerman RussianGhanaianGreekGuamanian/ChamorroGuatemalanGuyaneseHaitianHmongHonduranHopiHoumaHungarianIcelanderIndian (Asian)IndonesianInupiatIranianIraqiIrishIroquoisIsraeliItalianJamaicanJapaneseJordanianKenyanKiowaKoreanLaotianLatvianLebaneseLiberianLithuanianLumbeeLuxembourgerMacedonianMalaysianMalteseMarshalleseMenomineeMexicanMexican American IndianMongolianMoroccanNative HawaiianNavajoNepaleseNew ZealanderNicaraguanNigerianNorthern EuropeanNorwegianOkinawanOsageOttawaPaiutePakistaniPalestinianPanamanianParaguayanPennsylvania GermanPeruvianPimaPolishPortuguesePotawatomiPuebloPuerto RicanPuget Sound SalishRomanianRussianSalvadoranSamoanScandinavianScotch-IrishScottishSeminoleSenegaleseSerbianShoshoneSierra LeoneanSiouxSlavicSlovakSloveneSomaliSouth AfricanSouth AmericanSouth American IndianSoviet UnionSpaniardSpanishSpanish AmericanSpanish American IndianSri LankanSubsaharan AfricanSudaneseSwedishSwissSyrianTaiwaneseThaiTlingit-HaidaTohono O'OdhamTonganTrinidadian and TobagonianTsimshianTurkishU.S. Virgin IslanderUgandanUkrainianUruguayanUteVenezuelanVietnameseWelshWest IndianYakamaYaquiYugoslavianYumanYup'ikZimbabwean
Immigration
NonimmigrantsImmigrantsAfghanistanAfricaAlbaniaArgentinaArmeniaAsiaAustraliaAustriaBahamasBangladeshBarbadosBelarusBelgiumBelizeBoliviaBosnia and HerzegovinaBrazilBulgariaBurma/MyanmarCabo VerdeCambodiaCameroonCanadaCaribbeanCentral AmericaChileChinaColombiaCongoCosta RicaCroatiaCubaCzechoslovakiaDenmarkDominicaDominican RepublicEastern AfricaEastern AsiaEastern EuropeEcuadorEgyptEl SalvadorEnglandEritreaEthiopiaEuropeFijiFranceGermanyGhanaGreeceGrenadaGuatemalaGuyanaHaitiHondurasHong KongHungaryIndiaIndonesiaIranIraqIrelandIsraelItalyJamaicaJapanJordanKazakhstanKenyaKoreaKuwaitLaosLatin AmericaLatviaLebanonLiberiaLithuaniaMalaysiaMexicoMicronesiaMiddle AfricaMoldovaMoroccoNepalNetherlandsNicaraguaNigeriaNorth AmericaNorth MacedoniaNorthern AfricaNorthern EuropeNorwayOceaniaPakistanPanamaPeruPhilippinesPolandPortugalRomaniaRussiaSaudi ArabiaScotlandSenegalSerbiaSierra LeoneSingaporeSomaliaSouth AfricaSouth AmericaSouth Central AsiaSouth Eastern AsiaSouthern EuropeSpainSri LankaSt. Vincent and the GrenadinesSudanSwedenSwitzerlandSyriaTaiwanThailandTrinidad and TobagoTurkeyUgandaUkraineUruguayUzbekistanVenezuelaVietnamWest IndiesWestern AfricaWestern AsiaWestern EuropeYemenZaireZimbabweAzores
Ethiopian
Race
Ancestry
AfghanAfricanAlaska NativeAlaskan AthabascanAlbanianAleutAlsatianAmericanApacheArabArapahoArgentineanArmenianAssyrian/Chaldean/SyriacAustralianAustrianBahamianBangladeshiBarbadianBasqueBelgianBelizeanBermudanBhutaneseBlackfeetBolivianBrazilianBritishBritish West IndianBulgarianBurmeseCajunCambodianCanadianCape VerdeanCarpatho RusynCelticCentral AmericanCentral American IndianCherokeeCheyenneChickasawChileanChineseChippewaChoctawColombianColvilleComancheCosta RicanCreeCreekCroatianCrowCubanCypriotCzechCzechoslovakianDanishDelawareDominicanDutchDutch West IndianEastern EuropeanEcuadorianEgyptianEnglishEstonianEthiopianEuropeanFijianFilipinoFinnishFrenchFrench American IndianFrench CanadianGermanGerman RussianGhanaianGreekGuamanian/ChamorroGuatemalanGuyaneseHaitianHmongHonduranHopiHoumaHungarianIcelanderIndian (Asian)IndonesianInupiatIranianIraqiIrishIroquoisIsraeliItalianJamaicanJapaneseJordanianKenyanKiowaKoreanLaotianLatvianLebaneseLiberianLithuanianLumbeeLuxembourgerMacedonianMalaysianMalteseMarshalleseMenomineeMexicanMexican American IndianMongolianMoroccanNative HawaiianNavajoNepaleseNew ZealanderNicaraguanNigerianNorthern EuropeanNorwegianOkinawanOsageOttawaPaiutePakistaniPalestinianPanamanianParaguayanPennsylvania GermanPeruvianPimaPolishPortuguesePotawatomiPuebloPuerto RicanPuget Sound SalishRomanianRussianSalvadoranSamoanScandinavianScotch-IrishScottishSeminoleSenegaleseSerbianShoshoneSierra LeoneanSiouxSlavicSlovakSloveneSomaliSouth AfricanSouth AmericanSouth American IndianSoviet UnionSpaniardSpanishSpanish AmericanSpanish American IndianSri LankanSubsaharan AfricanSudaneseSwedishSwissSyrianTaiwaneseThaiTlingit-HaidaTohono O'OdhamTonganTrinidadian and TobagonianTsimshianTurkishU.S. Virgin IslanderUgandanUkrainianUruguayanUteVenezuelanVietnameseWelshWest IndianYakamaYaquiYugoslavianYumanYup'ikZimbabwean
Immigration
NonimmigrantsImmigrantsAfghanistanAfricaAlbaniaArgentinaArmeniaAsiaAustraliaAustriaBahamasBangladeshBarbadosBelarusBelgiumBelizeBoliviaBosnia and HerzegovinaBrazilBulgariaBurma/MyanmarCabo VerdeCambodiaCameroonCanadaCaribbeanCentral AmericaChileChinaColombiaCongoCosta RicaCroatiaCubaCzechoslovakiaDenmarkDominicaDominican RepublicEastern AfricaEastern AsiaEastern EuropeEcuadorEgyptEl SalvadorEnglandEritreaEthiopiaEuropeFijiFranceGermanyGhanaGreeceGrenadaGuatemalaGuyanaHaitiHondurasHong KongHungaryIndiaIndonesiaIranIraqIrelandIsraelItalyJamaicaJapanJordanKazakhstanKenyaKoreaKuwaitLaosLatin AmericaLatviaLebanonLiberiaLithuaniaMalaysiaMexicoMicronesiaMiddle AfricaMoldovaMoroccoNepalNetherlandsNicaraguaNigeriaNorth AmericaNorth MacedoniaNorthern AfricaNorthern EuropeNorwayOceaniaPakistanPanamaPeruPhilippinesPolandPortugalRomaniaRussiaSaudi ArabiaScotlandSenegalSerbiaSierra LeoneSingaporeSomaliaSouth AfricaSouth AmericaSouth Central AsiaSouth Eastern AsiaSouthern EuropeSpainSri LankaSt. Vincent and the GrenadinesSudanSwitzerlandSyriaTaiwanThailandTrinidad and TobagoTurkeyUgandaUkraineUruguayUzbekistanVenezuelaVietnamWest IndiesWestern AfricaWestern AsiaWestern EuropeYemenZaireZimbabweAzores
Associate's Degree
Income
Poverty
Unemployment
Labor Participation
Family Structure
Vehicle Availability
Education Level
Disability

Associate's Degree Comparison

Immigrants from Sweden

Ethiopians

Exceptional
Exceptional
54.6%
ASSOCIATE'S DEGREE
100.0/ 100
METRIC RATING
21st/ 347
METRIC RANK
50.4%
ASSOCIATE'S DEGREE
99.1/ 100
METRIC RATING
79th/ 347
METRIC RANK

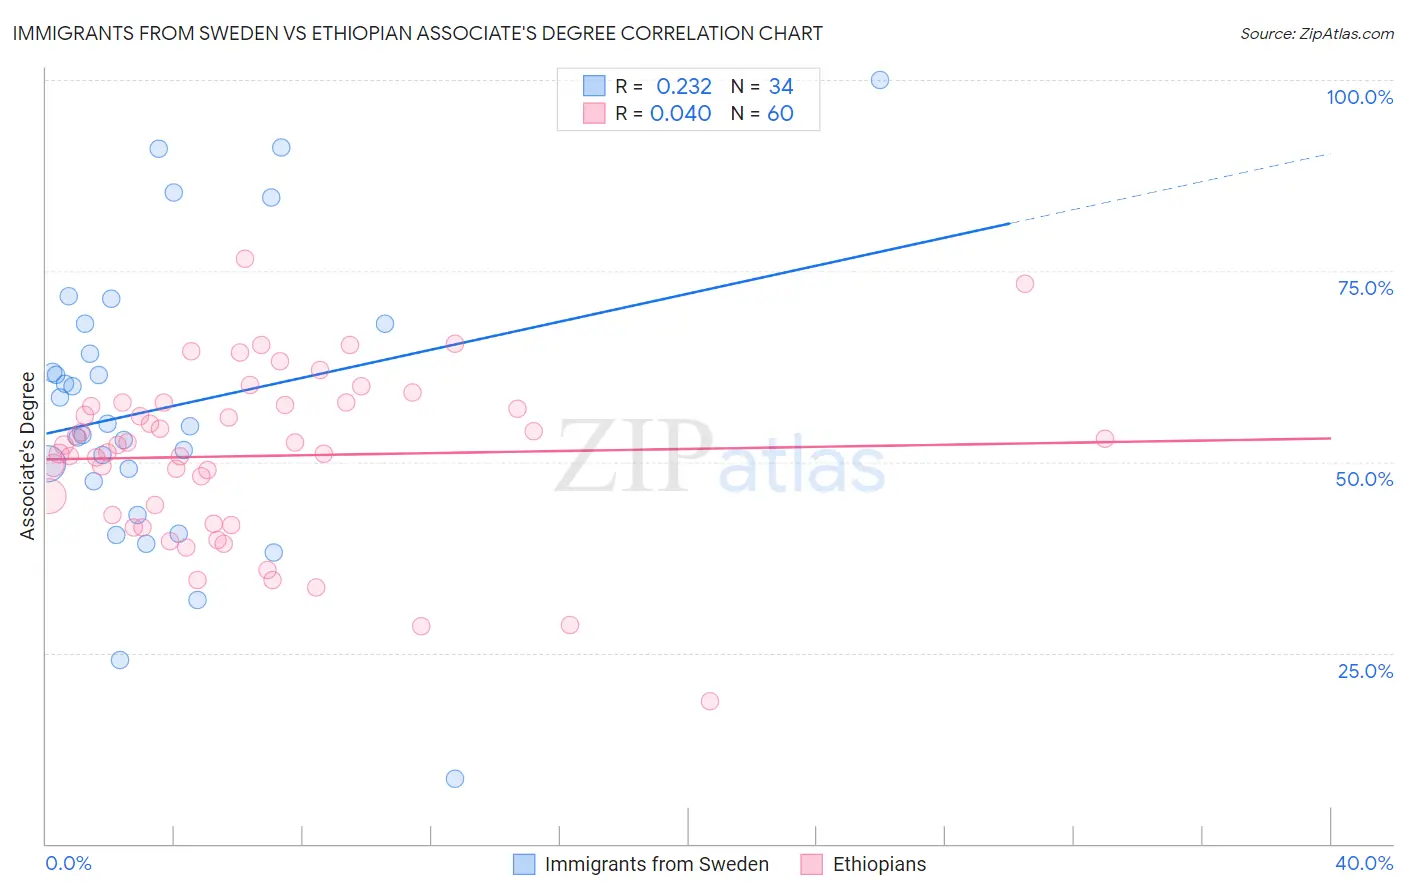
Immigrants from Sweden vs Ethiopian Associate's Degree Correlation Chart

The statistical analysis conducted on geographies consisting of 164,727,727 people shows a weak positive correlation between the proportion of Immigrants from Sweden and percentage of population with at least associate's degree education in the United States with a correlation coefficient (R) of 0.232 and weighted average of 54.6%. Similarly, the statistical analysis conducted on geographies consisting of 223,259,495 people shows no correlation between the proportion of Ethiopians and percentage of population with at least associate's degree education in the United States with a correlation coefficient (R) of 0.040 and weighted average of 50.4%, a difference of 8.3%.
Immigrants from Sweden vs Ethiopian Associate's Degree

Associate's Degree Correlation Summary

MeasurementImmigrants from SwedenEthiopian
Minimum8.6%18.6%
Maximum100.0%76.6%
Range91.4%58.0%
Mean57.1%50.8%
Median54.8%52.2%
Interquartile 25% (IQ1)47.4%42.5%
Interquartile 75% (IQ3)68.1%57.6%
Interquartile Range (IQR)20.7%15.1%
Standard Deviation (Sample)19.3%11.1%
Standard Deviation (Population)19.0%11.0%

Similar Demographics by Associate's Degree

Demographics Similar to Immigrants from Sweden by Associate's Degree

In terms of associate's degree, the demographic groups most similar to Immigrants from Sweden are Immigrants from Japan (54.6%, a difference of 0.030%), Burmese (54.6%, a difference of 0.030%), Cambodian (54.6%, a difference of 0.060%), Immigrants from Ireland (54.7%, a difference of 0.090%), and Immigrants from Korea (54.5%, a difference of 0.12%).
DemographicsRating | RankAssociate's Degree
Immigrants | Hong Kong
100.0
/100
|
#14
Exceptional
55.4%
Immigrants | Eastern Asia
100.0
/100
|
#15
Exceptional
55.4%
Soviet Union
100.0
/100
|
#16
Exceptional
55.1%
Eastern Europeans
100.0
/100
|
#17
Exceptional
55.0%
Indians (Asian)
100.0
/100
|
#18
Exceptional
54.8%
Immigrants | Ireland
100.0
/100
|
#19
Exceptional
54.7%
Cambodians
100.0
/100
|
#20
Exceptional
54.6%
Immigrants | Sweden
100.0
/100
|
#21
Exceptional
54.6%
Immigrants | Japan
100.0
/100
|
#22
Exceptional
54.6%
Burmese
100.0
/100
|
#23
Exceptional
54.6%
Immigrants | Korea
100.0
/100
|
#24
Exceptional
54.5%
Immigrants | Switzerland
100.0
/100
|
#25
Exceptional
54.5%
Immigrants | Belgium
100.0
/100
|
#26
Exceptional
54.5%
Latvians
100.0
/100
|
#27
Exceptional
53.9%
Turks
100.0
/100
|
#28
Exceptional
53.9%

Demographics Similar to Ethiopians by Associate's Degree

In terms of associate's degree, the demographic groups most similar to Ethiopians are Immigrants from Eastern Europe (50.5%, a difference of 0.010%), Armenian (50.4%, a difference of 0.030%), Immigrants from Lebanon (50.5%, a difference of 0.060%), Immigrants from Zimbabwe (50.5%, a difference of 0.090%), and Maltese (50.4%, a difference of 0.10%).
DemographicsRating | RankAssociate's Degree
Immigrants | Pakistan
99.5
/100
|
#72
Exceptional
50.9%
Carpatho Rusyns
99.3
/100
|
#73
Exceptional
50.6%
Lithuanians
99.3
/100
|
#74
Exceptional
50.6%
Immigrants | Scotland
99.3
/100
|
#75
Exceptional
50.6%
Immigrants | Zimbabwe
99.2
/100
|
#76
Exceptional
50.5%
Immigrants | Lebanon
99.1
/100
|
#77
Exceptional
50.5%
Immigrants | Eastern Europe
99.1
/100
|
#78
Exceptional
50.5%
Ethiopians
99.1
/100
|
#79
Exceptional
50.4%
Armenians
99.1
/100
|
#80
Exceptional
50.4%
Maltese
99.1
/100
|
#81
Exceptional
50.4%
Greeks
98.9
/100
|
#82
Exceptional
50.3%
Immigrants | Uzbekistan
98.9
/100
|
#83
Exceptional
50.3%
Immigrants | Hungary
98.9
/100
|
#84
Exceptional
50.2%
Immigrants | Egypt
98.9
/100
|
#85
Exceptional
50.2%
Immigrants | Croatia
98.9
/100
|
#86
Exceptional
50.2%