Immigrants from Sweden vs Barbadian 5th Grade

COMPARE

Immigrants from Sweden
Race
Ancestry
AfghanAfricanAlaska NativeAlaskan AthabascanAlbanianAleutAlsatianAmericanApacheArabArapahoArgentineanArmenianAssyrian/Chaldean/SyriacAustralianAustrianBahamianBangladeshiBasqueBelgianBelizeanBermudanBhutaneseBlackfeetBolivianBrazilianBritishBritish West IndianBulgarianBurmeseCajunCambodianCanadianCape VerdeanCarpatho RusynCelticCentral AmericanCentral American IndianCherokeeCheyenneChickasawChileanChineseChippewaChoctawColombianColvilleComancheCosta RicanCreeCreekCroatianCrowCubanCypriotCzechCzechoslovakianDanishDelawareDominicanDutchDutch West IndianEastern EuropeanEcuadorianEgyptianEnglishEstonianEthiopianEuropeanFijianFilipinoFinnishFrenchFrench American IndianFrench CanadianGermanGerman RussianGhanaianGreekGuamanian/ChamorroGuatemalanGuyaneseHaitianHmongHonduranHopiHoumaHungarianIcelanderIndian (Asian)IndonesianInupiatIranianIraqiIrishIroquoisIsraeliItalianJamaicanJapaneseJordanianKenyanKiowaKoreanLaotianLatvianLebaneseLiberianLithuanianLumbeeLuxembourgerMacedonianMalaysianMalteseMarshalleseMenomineeMexicanMexican American IndianMongolianMoroccanNative HawaiianNavajoNepaleseNew ZealanderNicaraguanNigerianNorthern EuropeanNorwegianOkinawanOsageOttawaPaiutePakistaniPalestinianPanamanianParaguayanPennsylvania GermanPeruvianPimaPolishPortuguesePotawatomiPuebloPuerto RicanPuget Sound SalishRomanianRussianSalvadoranSamoanScandinavianScotch-IrishScottishSeminoleSenegaleseSerbianShoshoneSierra LeoneanSiouxSlavicSlovakSloveneSomaliSouth AfricanSouth AmericanSouth American IndianSoviet UnionSpaniardSpanishSpanish AmericanSpanish American IndianSri LankanSubsaharan AfricanSudaneseSwedishSwissSyrianTaiwaneseThaiTlingit-HaidaTohono O'OdhamTonganTrinidadian and TobagonianTsimshianTurkishU.S. Virgin IslanderUgandanUkrainianUruguayanUteVenezuelanVietnameseWelshWest IndianYakamaYaquiYugoslavianYumanYup'ikZimbabwean
Immigration
NonimmigrantsImmigrantsAfghanistanAfricaAlbaniaArgentinaArmeniaAsiaAustraliaAustriaBahamasBangladeshBarbadosBelarusBelgiumBelizeBoliviaBosnia and HerzegovinaBrazilBulgariaBurma/MyanmarCabo VerdeCambodiaCameroonCanadaCaribbeanCentral AmericaChileChinaColombiaCongoCosta RicaCroatiaCubaCzechoslovakiaDenmarkDominicaDominican RepublicEastern AfricaEastern AsiaEastern EuropeEcuadorEgyptEl SalvadorEnglandEritreaEthiopiaEuropeFijiFranceGermanyGhanaGreeceGrenadaGuatemalaGuyanaHaitiHondurasHong KongHungaryIndiaIndonesiaIranIraqIrelandIsraelItalyJamaicaJapanJordanKazakhstanKenyaKoreaKuwaitLaosLatin AmericaLatviaLebanonLiberiaLithuaniaMalaysiaMexicoMicronesiaMiddle AfricaMoldovaMoroccoNepalNetherlandsNicaraguaNigeriaNorth AmericaNorth MacedoniaNorthern AfricaNorthern EuropeNorwayOceaniaPakistanPanamaPeruPhilippinesPolandPortugalRomaniaRussiaSaudi ArabiaScotlandSenegalSerbiaSierra LeoneSingaporeSomaliaSouth AfricaSouth AmericaSouth Central AsiaSouth Eastern AsiaSouthern EuropeSpainSri LankaSt. Vincent and the GrenadinesSudanSwedenSwitzerlandSyriaTaiwanThailandTrinidad and TobagoTurkeyUgandaUkraineUruguayUzbekistanVenezuelaVietnamWest IndiesWestern AfricaWestern AsiaWestern EuropeYemenZaireZimbabweAzores
Barbadian
Race
Ancestry
AfghanAfricanAlaska NativeAlaskan AthabascanAlbanianAleutAlsatianAmericanApacheArabArapahoArgentineanArmenianAssyrian/Chaldean/SyriacAustralianAustrianBahamianBangladeshiBarbadianBasqueBelgianBelizeanBermudanBhutaneseBlackfeetBolivianBrazilianBritishBritish West IndianBulgarianBurmeseCajunCambodianCanadianCape VerdeanCarpatho RusynCelticCentral AmericanCentral American IndianCherokeeCheyenneChickasawChileanChineseChippewaChoctawColombianColvilleComancheCosta RicanCreeCreekCroatianCrowCubanCypriotCzechCzechoslovakianDanishDelawareDominicanDutchDutch West IndianEastern EuropeanEcuadorianEgyptianEnglishEstonianEthiopianEuropeanFijianFilipinoFinnishFrenchFrench American IndianFrench CanadianGermanGerman RussianGhanaianGreekGuamanian/ChamorroGuatemalanGuyaneseHaitianHmongHonduranHopiHoumaHungarianIcelanderIndian (Asian)IndonesianInupiatIranianIraqiIrishIroquoisIsraeliItalianJamaicanJapaneseJordanianKenyanKiowaKoreanLaotianLatvianLebaneseLiberianLithuanianLumbeeLuxembourgerMacedonianMalaysianMalteseMarshalleseMenomineeMexicanMexican American IndianMongolianMoroccanNative HawaiianNavajoNepaleseNew ZealanderNicaraguanNigerianNorthern EuropeanNorwegianOkinawanOsageOttawaPaiutePakistaniPalestinianPanamanianParaguayanPennsylvania GermanPeruvianPimaPolishPortuguesePotawatomiPuebloPuerto RicanPuget Sound SalishRomanianRussianSalvadoranSamoanScandinavianScotch-IrishScottishSeminoleSenegaleseSerbianShoshoneSierra LeoneanSiouxSlavicSlovakSloveneSomaliSouth AfricanSouth AmericanSouth American IndianSoviet UnionSpaniardSpanishSpanish AmericanSpanish American IndianSri LankanSubsaharan AfricanSudaneseSwedishSwissSyrianTaiwaneseThaiTlingit-HaidaTohono O'OdhamTonganTrinidadian and TobagonianTsimshianTurkishU.S. Virgin IslanderUgandanUkrainianUruguayanUteVenezuelanVietnameseWelshWest IndianYakamaYaquiYugoslavianYumanYup'ikZimbabwean
Immigration
NonimmigrantsImmigrantsAfghanistanAfricaAlbaniaArgentinaArmeniaAsiaAustraliaAustriaBahamasBangladeshBarbadosBelarusBelgiumBelizeBoliviaBosnia and HerzegovinaBrazilBulgariaBurma/MyanmarCabo VerdeCambodiaCameroonCanadaCaribbeanCentral AmericaChileChinaColombiaCongoCosta RicaCroatiaCubaCzechoslovakiaDenmarkDominicaDominican RepublicEastern AfricaEastern AsiaEastern EuropeEcuadorEgyptEl SalvadorEnglandEritreaEthiopiaEuropeFijiFranceGermanyGhanaGreeceGrenadaGuatemalaGuyanaHaitiHondurasHong KongHungaryIndiaIndonesiaIranIraqIrelandIsraelItalyJamaicaJapanJordanKazakhstanKenyaKoreaKuwaitLaosLatin AmericaLatviaLebanonLiberiaLithuaniaMalaysiaMexicoMicronesiaMiddle AfricaMoldovaMoroccoNepalNetherlandsNicaraguaNigeriaNorth AmericaNorth MacedoniaNorthern AfricaNorthern EuropeNorwayOceaniaPakistanPanamaPeruPhilippinesPolandPortugalRomaniaRussiaSaudi ArabiaScotlandSenegalSerbiaSierra LeoneSingaporeSomaliaSouth AfricaSouth AmericaSouth Central AsiaSouth Eastern AsiaSouthern EuropeSpainSri LankaSt. Vincent and the GrenadinesSudanSwitzerlandSyriaTaiwanThailandTrinidad and TobagoTurkeyUgandaUkraineUruguayUzbekistanVenezuelaVietnamWest IndiesWestern AfricaWestern AsiaWestern EuropeYemenZaireZimbabweAzores
5th Grade
Income
Poverty
Unemployment
Labor Participation
Family Structure
Vehicle Availability
Education Level
Disability

5th Grade Comparison

Immigrants from Sweden

Barbadians

Exceptional
Tragic
97.8%
5TH GRADE
98.7/ 100
METRIC RATING
92nd/ 347
METRIC RANK
96.6%
5TH GRADE
0.1/ 100
METRIC RATING
282nd/ 347
METRIC RANK

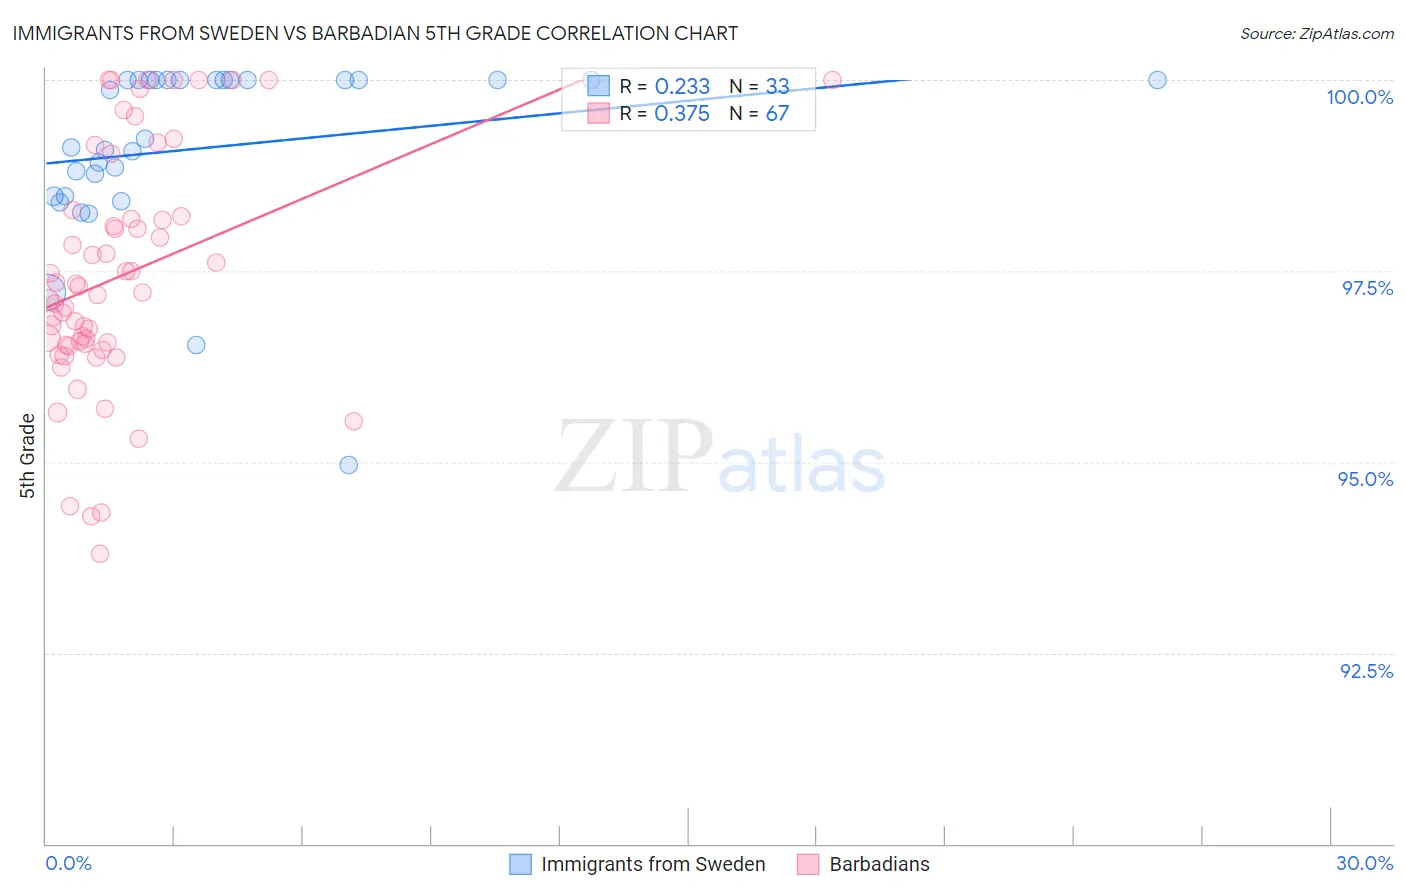
Immigrants from Sweden vs Barbadian 5th Grade Correlation Chart

The statistical analysis conducted on geographies consisting of 164,737,092 people shows a weak positive correlation between the proportion of Immigrants from Sweden and percentage of population with at least 5th grade education in the United States with a correlation coefficient (R) of 0.233 and weighted average of 97.8%. Similarly, the statistical analysis conducted on geographies consisting of 141,304,590 people shows a mild positive correlation between the proportion of Barbadians and percentage of population with at least 5th grade education in the United States with a correlation coefficient (R) of 0.375 and weighted average of 96.6%, a difference of 1.2%.
Immigrants from Sweden vs Barbadian 5th Grade

5th Grade Correlation Summary

MeasurementImmigrants from SwedenBarbadian
Minimum95.0%93.8%
Maximum100.0%100.0%
Range5.0%6.2%
Mean99.1%97.4%
Median99.2%97.2%
Interquartile 25% (IQ1)98.5%96.5%
Interquartile 75% (IQ3)100.0%98.2%
Interquartile Range (IQR)1.5%1.7%
Standard Deviation (Sample)1.2%1.5%
Standard Deviation (Population)1.1%1.5%

Similar Demographics by 5th Grade

Demographics Similar to Immigrants from Sweden by 5th Grade

In terms of 5th grade, the demographic groups most similar to Immigrants from Sweden are Immigrants from Western Europe (97.8%, a difference of 0.0%), Immigrants from Australia (97.8%, a difference of 0.010%), Shoshone (97.8%, a difference of 0.010%), Immigrants from South Africa (97.8%, a difference of 0.010%), and Immigrants from Ireland (97.8%, a difference of 0.010%).
DemographicsRating | Rank5th Grade
Immigrants | Belgium
99.0
/100
|
#85
Exceptional
97.8%
Cypriots
98.9
/100
|
#86
Exceptional
97.8%
Immigrants | Australia
98.8
/100
|
#87
Exceptional
97.8%
Shoshone
98.8
/100
|
#88
Exceptional
97.8%
Immigrants | South Africa
98.8
/100
|
#89
Exceptional
97.8%
Immigrants | Ireland
98.8
/100
|
#90
Exceptional
97.8%
Immigrants | Western Europe
98.8
/100
|
#91
Exceptional
97.8%
Immigrants | Sweden
98.7
/100
|
#92
Exceptional
97.8%
Delaware
98.6
/100
|
#93
Exceptional
97.8%
Immigrants | Denmark
98.6
/100
|
#94
Exceptional
97.8%
Romanians
98.6
/100
|
#95
Exceptional
97.8%
Immigrants | Germany
98.5
/100
|
#96
Exceptional
97.8%
Cree
98.4
/100
|
#97
Exceptional
97.7%
Yugoslavians
98.3
/100
|
#98
Exceptional
97.7%
Turks
98.3
/100
|
#99
Exceptional
97.7%

Demographics Similar to Barbadians by 5th Grade

In terms of 5th grade, the demographic groups most similar to Barbadians are Immigrants from Western Africa (96.6%, a difference of 0.0%), Houma (96.6%, a difference of 0.0%), Fijian (96.6%, a difference of 0.0%), Immigrants from Philippines (96.6%, a difference of 0.010%), and Immigrants from Trinidad and Tobago (96.6%, a difference of 0.010%).
DemographicsRating | Rank5th Grade
Immigrants | Peru
0.1
/100
|
#275
Tragic
96.6%
Cubans
0.1
/100
|
#276
Tragic
96.6%
Immigrants | Bolivia
0.1
/100
|
#277
Tragic
96.6%
Immigrants | Ghana
0.1
/100
|
#278
Tragic
96.6%
Immigrants | Philippines
0.1
/100
|
#279
Tragic
96.6%
Immigrants | Western Africa
0.1
/100
|
#280
Tragic
96.6%
Houma
0.1
/100
|
#281
Tragic
96.6%
Barbadians
0.1
/100
|
#282
Tragic
96.6%
Fijians
0.1
/100
|
#283
Tragic
96.6%
Immigrants | Trinidad and Tobago
0.1
/100
|
#284
Tragic
96.6%
Immigrants | St. Vincent and the Grenadines
0.1
/100
|
#285
Tragic
96.6%
Immigrants | Thailand
0.1
/100
|
#286
Tragic
96.6%
Immigrants | Afghanistan
0.1
/100
|
#287
Tragic
96.6%
Immigrants | Barbados
0.0
/100
|
#288
Tragic
96.6%
Immigrants | West Indies
0.0
/100
|
#289
Tragic
96.5%