Immigrants from Sudan vs Chinese Kindergarten

COMPARE

Immigrants from Sudan
Race
Ancestry
AfghanAfricanAlaska NativeAlaskan AthabascanAlbanianAleutAlsatianAmericanApacheArabArapahoArgentineanArmenianAssyrian/Chaldean/SyriacAustralianAustrianBahamianBangladeshiBarbadianBasqueBelgianBelizeanBermudanBhutaneseBlackfeetBolivianBrazilianBritishBritish West IndianBulgarianBurmeseCajunCambodianCanadianCape VerdeanCarpatho RusynCelticCentral AmericanCentral American IndianCherokeeCheyenneChickasawChileanChippewaChoctawColombianColvilleComancheCosta RicanCreeCreekCroatianCrowCubanCypriotCzechCzechoslovakianDanishDelawareDominicanDutchDutch West IndianEastern EuropeanEcuadorianEgyptianEnglishEstonianEthiopianEuropeanFijianFilipinoFinnishFrenchFrench American IndianFrench CanadianGermanGerman RussianGhanaianGreekGuamanian/ChamorroGuatemalanGuyaneseHaitianHmongHonduranHopiHoumaHungarianIcelanderIndian (Asian)IndonesianInupiatIranianIraqiIrishIroquoisIsraeliItalianJamaicanJapaneseJordanianKenyanKiowaKoreanLaotianLatvianLebaneseLiberianLithuanianLumbeeLuxembourgerMacedonianMalaysianMalteseMarshalleseMenomineeMexicanMexican American IndianMongolianMoroccanNative HawaiianNavajoNepaleseNew ZealanderNicaraguanNigerianNorthern EuropeanNorwegianOkinawanOsageOttawaPaiutePakistaniPalestinianPanamanianParaguayanPennsylvania GermanPeruvianPimaPolishPortuguesePotawatomiPuebloPuerto RicanPuget Sound SalishRomanianRussianSalvadoranSamoanScandinavianScotch-IrishScottishSeminoleSenegaleseSerbianShoshoneSierra LeoneanSiouxSlavicSlovakSloveneSomaliSouth AfricanSouth AmericanSouth American IndianSoviet UnionSpaniardSpanishSpanish AmericanSpanish American IndianSri LankanSubsaharan AfricanSudaneseSwedishSwissSyrianTaiwaneseThaiTlingit-HaidaTohono O'OdhamTonganTrinidadian and TobagonianTsimshianTurkishU.S. Virgin IslanderUgandanUkrainianUruguayanUteVenezuelanVietnameseWelshWest IndianYakamaYaquiYugoslavianYumanYup'ikZimbabwean
Immigration
NonimmigrantsImmigrantsAfghanistanAfricaAlbaniaArgentinaArmeniaAsiaAustraliaAustriaBahamasBangladeshBarbadosBelarusBelgiumBelizeBoliviaBosnia and HerzegovinaBrazilBulgariaBurma/MyanmarCabo VerdeCambodiaCameroonCanadaCaribbeanCentral AmericaChileChinaColombiaCongoCosta RicaCroatiaCubaCzechoslovakiaDenmarkDominicaDominican RepublicEastern AfricaEastern AsiaEastern EuropeEcuadorEgyptEl SalvadorEnglandEritreaEthiopiaEuropeFijiFranceGermanyGhanaGreeceGrenadaGuatemalaGuyanaHaitiHondurasHong KongHungaryIndiaIndonesiaIranIraqIrelandIsraelItalyJamaicaJapanJordanKazakhstanKenyaKoreaKuwaitLaosLatin AmericaLatviaLebanonLiberiaLithuaniaMalaysiaMexicoMicronesiaMiddle AfricaMoldovaMoroccoNepalNetherlandsNicaraguaNigeriaNorth AmericaNorth MacedoniaNorthern AfricaNorthern EuropeNorwayOceaniaPakistanPanamaPeruPhilippinesPolandPortugalRomaniaRussiaSaudi ArabiaScotlandSenegalSerbiaSierra LeoneSingaporeSomaliaSouth AfricaSouth AmericaSouth Central AsiaSouth Eastern AsiaSouthern EuropeSpainSri LankaSt. Vincent and the GrenadinesSudanSwedenSwitzerlandSyriaTaiwanThailandTrinidad and TobagoTurkeyUgandaUkraineUruguayUzbekistanVenezuelaVietnamWest IndiesWestern AfricaWestern AsiaWestern EuropeYemenZaireZimbabweAzores
Chinese
Race
Ancestry
AfghanAfricanAlaska NativeAlaskan AthabascanAlbanianAleutAlsatianAmericanApacheArabArapahoArgentineanArmenianAssyrian/Chaldean/SyriacAustralianAustrianBahamianBangladeshiBarbadianBasqueBelgianBelizeanBermudanBhutaneseBlackfeetBolivianBrazilianBritishBritish West IndianBulgarianBurmeseCajunCambodianCanadianCape VerdeanCarpatho RusynCelticCentral AmericanCentral American IndianCherokeeCheyenneChickasawChileanChineseChippewaChoctawColombianColvilleComancheCosta RicanCreeCreekCroatianCrowCubanCypriotCzechCzechoslovakianDanishDelawareDominicanDutchDutch West IndianEastern EuropeanEcuadorianEgyptianEnglishEstonianEthiopianEuropeanFijianFilipinoFinnishFrenchFrench American IndianFrench CanadianGermanGerman RussianGhanaianGreekGuamanian/ChamorroGuatemalanGuyaneseHaitianHmongHonduranHopiHoumaHungarianIcelanderIndian (Asian)IndonesianInupiatIranianIraqiIrishIroquoisIsraeliItalianJamaicanJapaneseJordanianKenyanKiowaKoreanLaotianLatvianLebaneseLiberianLithuanianLumbeeLuxembourgerMacedonianMalaysianMalteseMarshalleseMenomineeMexicanMexican American IndianMongolianMoroccanNative HawaiianNavajoNepaleseNew ZealanderNicaraguanNigerianNorthern EuropeanNorwegianOkinawanOsageOttawaPaiutePakistaniPalestinianPanamanianParaguayanPennsylvania GermanPeruvianPimaPolishPortuguesePotawatomiPuebloPuerto RicanPuget Sound SalishRomanianRussianSalvadoranSamoanScandinavianScotch-IrishScottishSeminoleSenegaleseSerbianShoshoneSierra LeoneanSiouxSlavicSlovakSloveneSomaliSouth AfricanSouth AmericanSouth American IndianSoviet UnionSpaniardSpanishSpanish AmericanSpanish American IndianSri LankanSubsaharan AfricanSudaneseSwedishSwissSyrianTaiwaneseThaiTlingit-HaidaTohono O'OdhamTonganTrinidadian and TobagonianTsimshianTurkishU.S. Virgin IslanderUgandanUkrainianUruguayanUteVenezuelanVietnameseWelshWest IndianYakamaYaquiYugoslavianYumanYup'ikZimbabwean
Immigration
NonimmigrantsImmigrantsAfghanistanAfricaAlbaniaArgentinaArmeniaAsiaAustraliaAustriaBahamasBangladeshBarbadosBelarusBelgiumBelizeBoliviaBosnia and HerzegovinaBrazilBulgariaBurma/MyanmarCabo VerdeCambodiaCameroonCanadaCaribbeanCentral AmericaChileChinaColombiaCongoCosta RicaCroatiaCubaCzechoslovakiaDenmarkDominicaDominican RepublicEastern AfricaEastern AsiaEastern EuropeEcuadorEgyptEl SalvadorEnglandEritreaEthiopiaEuropeFijiFranceGermanyGhanaGreeceGrenadaGuatemalaGuyanaHaitiHondurasHong KongHungaryIndiaIndonesiaIranIraqIrelandIsraelItalyJamaicaJapanJordanKazakhstanKenyaKoreaKuwaitLaosLatin AmericaLatviaLebanonLiberiaLithuaniaMalaysiaMexicoMicronesiaMiddle AfricaMoldovaMoroccoNepalNetherlandsNicaraguaNigeriaNorth AmericaNorth MacedoniaNorthern AfricaNorthern EuropeNorwayOceaniaPakistanPanamaPeruPhilippinesPolandPortugalRomaniaRussiaSaudi ArabiaScotlandSenegalSerbiaSierra LeoneSingaporeSomaliaSouth AfricaSouth AmericaSouth Central AsiaSouth Eastern AsiaSouthern EuropeSpainSri LankaSt. Vincent and the GrenadinesSwedenSwitzerlandSyriaTaiwanThailandTrinidad and TobagoTurkeyUgandaUkraineUruguayUzbekistanVenezuelaVietnamWest IndiesWestern AfricaWestern AsiaWestern EuropeYemenZaireZimbabweAzores
Kindergarten
Income
Poverty
Unemployment
Labor Participation
Family Structure
Vehicle Availability
Education Level
Disability

Kindergarten Comparison

Immigrants from Sudan

Chinese

Tragic
Exceptional
97.7%
KINDERGARTEN
4.5/ 100
METRIC RATING
222nd/ 347
METRIC RANK
98.5%
KINDERGARTEN
100.0/ 100
METRIC RATING
34th/ 347
METRIC RANK

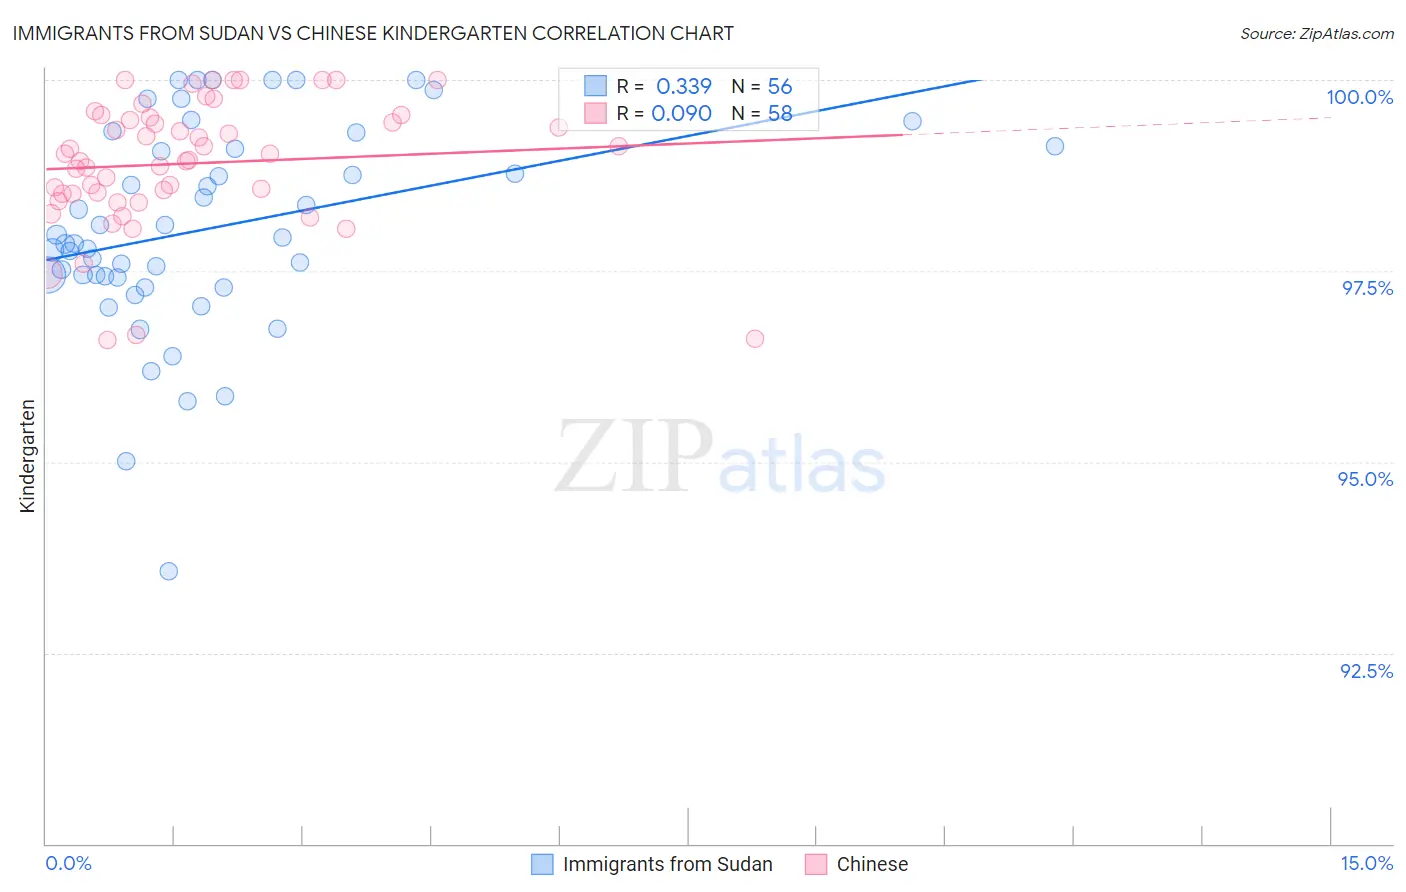
Immigrants from Sudan vs Chinese Kindergarten Correlation Chart

The statistical analysis conducted on geographies consisting of 118,957,985 people shows a mild positive correlation between the proportion of Immigrants from Sudan and percentage of population with at least kindergarten education in the United States with a correlation coefficient (R) of 0.339 and weighted average of 97.7%. Similarly, the statistical analysis conducted on geographies consisting of 64,808,307 people shows a slight positive correlation between the proportion of Chinese and percentage of population with at least kindergarten education in the United States with a correlation coefficient (R) of 0.090 and weighted average of 98.5%, a difference of 0.84%.
Immigrants from Sudan vs Chinese Kindergarten

Kindergarten Correlation Summary

MeasurementImmigrants from SudanChinese
Minimum93.6%96.6%
Maximum100.0%100.0%
Range6.4%3.4%
Mean98.1%98.9%
Median97.9%99.0%
Interquartile 25% (IQ1)97.4%98.5%
Interquartile 75% (IQ3)99.1%99.5%
Interquartile Range (IQR)1.7%0.99%
Standard Deviation (Sample)1.4%0.84%
Standard Deviation (Population)1.3%0.83%

Similar Demographics by Kindergarten

Demographics Similar to Immigrants from Sudan by Kindergarten

In terms of kindergarten, the demographic groups most similar to Immigrants from Sudan are Tongan (97.7%, a difference of 0.0%), Immigrants from Zaire (97.7%, a difference of 0.0%), Immigrants from Syria (97.7%, a difference of 0.0%), Immigrants from Panama (97.7%, a difference of 0.010%), and Iraqi (97.7%, a difference of 0.010%).
DemographicsRating | RankKindergarten
Immigrants | Bahamas
7.4
/100
|
#215
Tragic
97.8%
Samoans
6.9
/100
|
#216
Tragic
97.8%
Bahamians
6.6
/100
|
#217
Tragic
97.8%
Immigrants | Morocco
5.4
/100
|
#218
Tragic
97.7%
Immigrants | Panama
5.0
/100
|
#219
Tragic
97.7%
Tongans
4.8
/100
|
#220
Tragic
97.7%
Immigrants | Zaire
4.5
/100
|
#221
Tragic
97.7%
Immigrants | Sudan
4.5
/100
|
#222
Tragic
97.7%
Immigrants | Syria
4.3
/100
|
#223
Tragic
97.7%
Iraqis
3.9
/100
|
#224
Tragic
97.7%
Immigrants | Nepal
3.8
/100
|
#225
Tragic
97.7%
Sudanese
3.7
/100
|
#226
Tragic
97.7%
Immigrants | Costa Rica
3.6
/100
|
#227
Tragic
97.7%
Sub-Saharan Africans
3.5
/100
|
#228
Tragic
97.7%
Sierra Leoneans
3.4
/100
|
#229
Tragic
97.7%

Demographics Similar to Chinese by Kindergarten

In terms of kindergarten, the demographic groups most similar to Chinese are Swiss (98.5%, a difference of 0.0%), French Canadian (98.6%, a difference of 0.020%), Scandinavian (98.6%, a difference of 0.020%), British (98.5%, a difference of 0.020%), and French (98.6%, a difference of 0.030%).
DemographicsRating | RankKindergarten
Scotch-Irish
100.0
/100
|
#27
Exceptional
98.6%
Croatians
100.0
/100
|
#28
Exceptional
98.6%
French
100.0
/100
|
#29
Exceptional
98.6%
Europeans
100.0
/100
|
#30
Exceptional
98.6%
Czechs
100.0
/100
|
#31
Exceptional
98.6%
French Canadians
100.0
/100
|
#32
Exceptional
98.6%
Scandinavians
100.0
/100
|
#33
Exceptional
98.6%
Chinese
100.0
/100
|
#34
Exceptional
98.5%
Swiss
100.0
/100
|
#35
Exceptional
98.5%
British
99.9
/100
|
#36
Exceptional
98.5%
Italians
99.9
/100
|
#37
Exceptional
98.5%
Latvians
99.9
/100
|
#38
Exceptional
98.5%
Chippewa
99.9
/100
|
#39
Exceptional
98.5%
Luxembourgers
99.9
/100
|
#40
Exceptional
98.5%
Eastern Europeans
99.9
/100
|
#41
Exceptional
98.5%