Immigrants from St. Vincent and the Grenadines vs Immigrants from Kuwait Master's Degree
COMPARE
Immigrants from St. Vincent and the Grenadines
Immigrants from Kuwait
Master's Degree
Master's Degree Comparison
Immigrants from St. Vincent and the Grenadines
Immigrants from Kuwait
13.9%
MASTER'S DEGREE
11.0/ 100
METRIC RATING
226th/ 347
METRIC RANK
18.6%
MASTER'S DEGREE
100.0/ 100
METRIC RATING
52nd/ 347
METRIC RANK
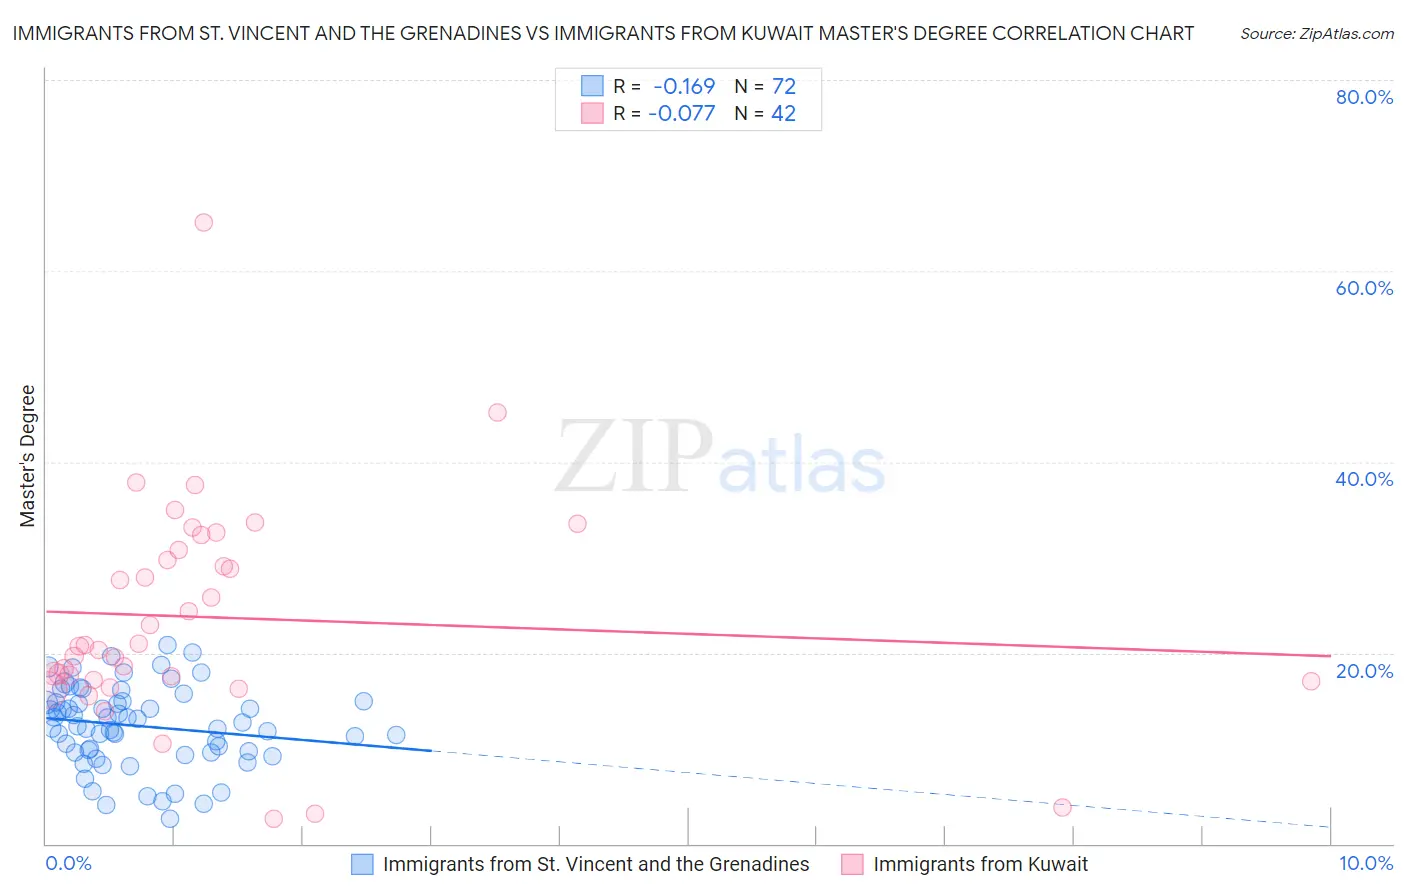
Immigrants from St. Vincent and the Grenadines vs Immigrants from Kuwait Master's Degree Correlation Chart
The statistical analysis conducted on geographies consisting of 56,186,980 people shows a poor negative correlation between the proportion of Immigrants from St. Vincent and the Grenadines and percentage of population with at least master's degree education in the United States with a correlation coefficient (R) of -0.169 and weighted average of 13.9%. Similarly, the statistical analysis conducted on geographies consisting of 136,916,630 people shows a slight negative correlation between the proportion of Immigrants from Kuwait and percentage of population with at least master's degree education in the United States with a correlation coefficient (R) of -0.077 and weighted average of 18.6%, a difference of 33.3%.
Master's Degree Correlation Summary
| Measurement | Immigrants from St. Vincent and the Grenadines | Immigrants from Kuwait |
| Minimum | 2.6% | 2.6% |
| Maximum | 20.8% | 65.1% |
| Range | 18.1% | 62.5% |
| Mean | 12.3% | 23.7% |
| Median | 12.5% | 20.7% |
| Interquartile 25% (IQ1) | 9.6% | 17.1% |
| Interquartile 75% (IQ3) | 14.9% | 30.8% |
| Interquartile Range (IQR) | 5.3% | 13.7% |
| Standard Deviation (Sample) | 4.2% | 11.5% |
| Standard Deviation (Population) | 4.1% | 11.4% |
Similar Demographics by Master's Degree
Demographics Similar to Immigrants from St. Vincent and the Grenadines by Master's Degree
In terms of master's degree, the demographic groups most similar to Immigrants from St. Vincent and the Grenadines are Portuguese (13.9%, a difference of 0.050%), Immigrants from Grenada (14.0%, a difference of 0.26%), Immigrants from South Eastern Asia (14.0%, a difference of 0.31%), Immigrants from West Indies (13.9%, a difference of 0.44%), and Ecuadorian (14.0%, a difference of 0.51%).
| Demographics | Rating | Rank | Master's Degree |
| Norwegians | 13.6 /100 | #219 | Poor 14.0% |
| Germans | 13.1 /100 | #220 | Poor 14.0% |
| Koreans | 12.7 /100 | #221 | Poor 14.0% |
| Ecuadorians | 12.6 /100 | #222 | Poor 14.0% |
| Immigrants | South Eastern Asia | 11.9 /100 | #223 | Poor 14.0% |
| Immigrants | Grenada | 11.8 /100 | #224 | Poor 14.0% |
| Portuguese | 11.2 /100 | #225 | Poor 13.9% |
| Immigrants | St. Vincent and the Grenadines | 11.0 /100 | #226 | Poor 13.9% |
| Immigrants | West Indies | 9.8 /100 | #227 | Tragic 13.9% |
| Whites/Caucasians | 9.1 /100 | #228 | Tragic 13.8% |
| British West Indians | 8.8 /100 | #229 | Tragic 13.8% |
| Dutch | 8.7 /100 | #230 | Tragic 13.8% |
| Guyanese | 7.6 /100 | #231 | Tragic 13.7% |
| Immigrants | Philippines | 6.0 /100 | #232 | Tragic 13.6% |
| Immigrants | Ecuador | 5.7 /100 | #233 | Tragic 13.6% |
Demographics Similar to Immigrants from Kuwait by Master's Degree
In terms of master's degree, the demographic groups most similar to Immigrants from Kuwait are Immigrants from Czechoslovakia (18.5%, a difference of 0.080%), Immigrants from Lithuania (18.5%, a difference of 0.39%), Immigrants from Serbia (18.5%, a difference of 0.42%), Asian (18.4%, a difference of 0.65%), and Immigrants from Asia (18.4%, a difference of 0.79%).
| Demographics | Rating | Rank | Master's Degree |
| Immigrants | Belarus | 100.0 /100 | #45 | Exceptional 18.9% |
| Immigrants | Norway | 100.0 /100 | #46 | Exceptional 18.8% |
| Immigrants | Austria | 100.0 /100 | #47 | Exceptional 18.8% |
| Paraguayans | 100.0 /100 | #48 | Exceptional 18.8% |
| Estonians | 100.0 /100 | #49 | Exceptional 18.8% |
| Bulgarians | 100.0 /100 | #50 | Exceptional 18.8% |
| Immigrants | South Africa | 100.0 /100 | #51 | Exceptional 18.8% |
| Immigrants | Kuwait | 100.0 /100 | #52 | Exceptional 18.6% |
| Immigrants | Czechoslovakia | 99.9 /100 | #53 | Exceptional 18.5% |
| Immigrants | Lithuania | 99.9 /100 | #54 | Exceptional 18.5% |
| Immigrants | Serbia | 99.9 /100 | #55 | Exceptional 18.5% |
| Asians | 99.9 /100 | #56 | Exceptional 18.4% |
| Immigrants | Asia | 99.9 /100 | #57 | Exceptional 18.4% |
| Australians | 99.9 /100 | #58 | Exceptional 18.4% |
| Immigrants | Bulgaria | 99.9 /100 | #59 | Exceptional 18.3% |