Immigrants from Sri Lanka vs Immigrants from Portugal 9th Grade
COMPARE
Immigrants from Sri Lanka
Immigrants from Portugal
9th Grade
9th Grade Comparison
Immigrants from Sri Lanka
Immigrants from Portugal
95.1%
9TH GRADE
82.1/ 100
METRIC RATING
146th/ 347
METRIC RANK
92.2%
9TH GRADE
0.0/ 100
METRIC RATING
314th/ 347
METRIC RANK
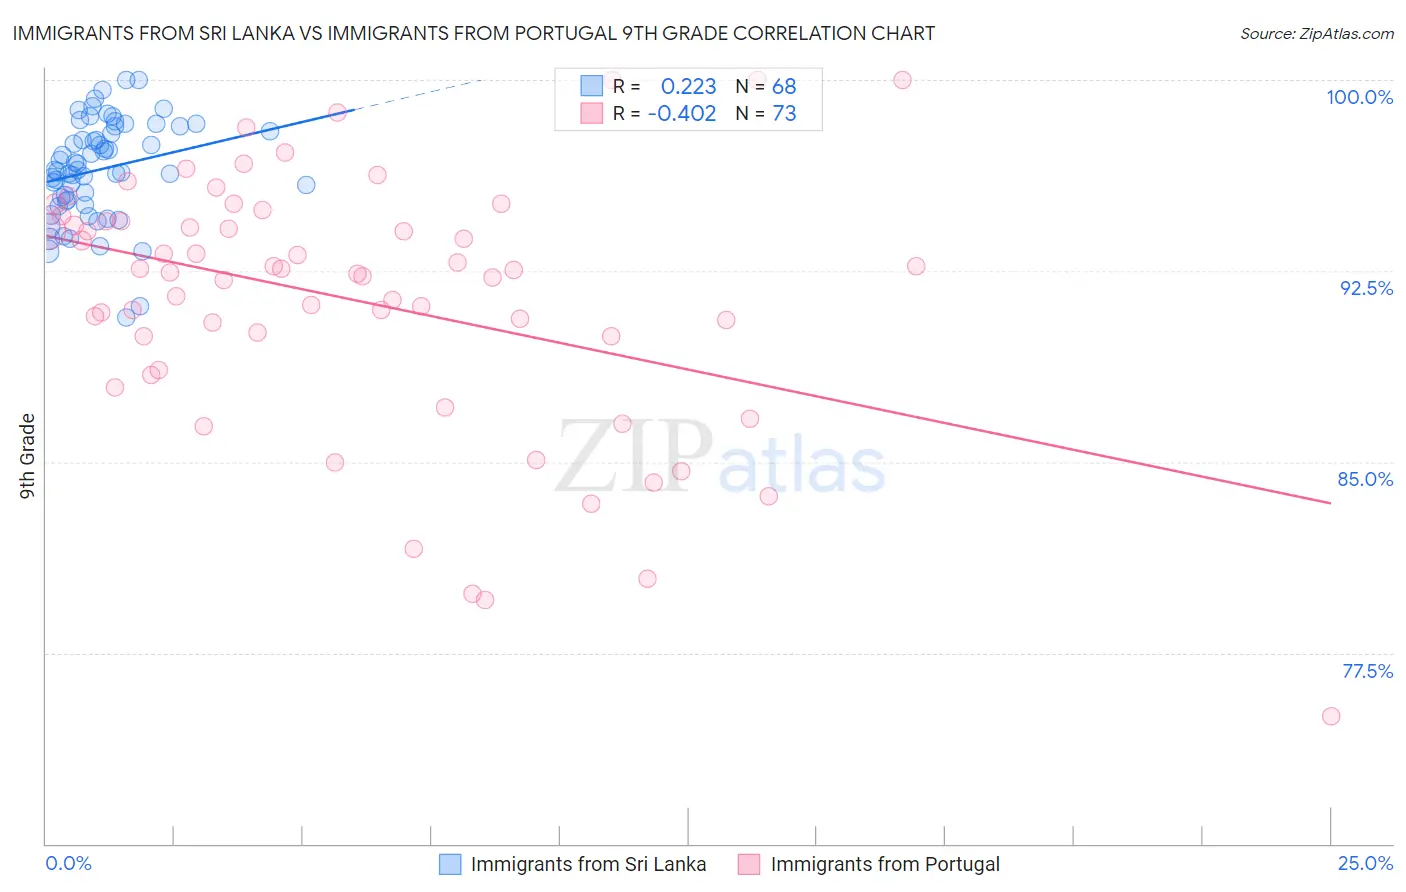
Immigrants from Sri Lanka vs Immigrants from Portugal 9th Grade Correlation Chart
The statistical analysis conducted on geographies consisting of 149,660,761 people shows a weak positive correlation between the proportion of Immigrants from Sri Lanka and percentage of population with at least 9th grade education in the United States with a correlation coefficient (R) of 0.223 and weighted average of 95.1%. Similarly, the statistical analysis conducted on geographies consisting of 174,792,107 people shows a moderate negative correlation between the proportion of Immigrants from Portugal and percentage of population with at least 9th grade education in the United States with a correlation coefficient (R) of -0.402 and weighted average of 92.2%, a difference of 3.1%.
9th Grade Correlation Summary
| Measurement | Immigrants from Sri Lanka | Immigrants from Portugal |
| Minimum | 90.7% | 75.0% |
| Maximum | 100.0% | 100.0% |
| Range | 9.3% | 25.0% |
| Mean | 96.5% | 91.3% |
| Median | 96.5% | 92.5% |
| Interquartile 25% (IQ1) | 95.3% | 89.3% |
| Interquartile 75% (IQ3) | 98.1% | 94.5% |
| Interquartile Range (IQR) | 2.8% | 5.2% |
| Standard Deviation (Sample) | 2.0% | 5.1% |
| Standard Deviation (Population) | 1.9% | 5.0% |
Similar Demographics by 9th Grade
Demographics Similar to Immigrants from Sri Lanka by 9th Grade
In terms of 9th grade, the demographic groups most similar to Immigrants from Sri Lanka are Pueblo (95.1%, a difference of 0.0%), Choctaw (95.1%, a difference of 0.0%), Immigrants from Jordan (95.1%, a difference of 0.010%), Yup'ik (95.2%, a difference of 0.020%), and Immigrants from Greece (95.2%, a difference of 0.030%).
| Demographics | Rating | Rank | 9th Grade |
| Immigrants | Eastern Europe | 85.8 /100 | #139 | Excellent 95.2% |
| Immigrants | Taiwan | 85.3 /100 | #140 | Excellent 95.2% |
| Immigrants | Bosnia and Herzegovina | 85.2 /100 | #141 | Excellent 95.2% |
| Immigrants | Greece | 84.6 /100 | #142 | Excellent 95.2% |
| Spanish | 84.4 /100 | #143 | Excellent 95.2% |
| Yup'ik | 83.3 /100 | #144 | Excellent 95.2% |
| Pueblo | 82.2 /100 | #145 | Excellent 95.1% |
| Immigrants | Sri Lanka | 82.1 /100 | #146 | Excellent 95.1% |
| Choctaw | 81.9 /100 | #147 | Excellent 95.1% |
| Immigrants | Jordan | 81.2 /100 | #148 | Excellent 95.1% |
| Immigrants | Korea | 79.6 /100 | #149 | Good 95.1% |
| Kenyans | 79.1 /100 | #150 | Good 95.1% |
| Cajuns | 77.3 /100 | #151 | Good 95.1% |
| Ugandans | 77.0 /100 | #152 | Good 95.1% |
| Albanians | 76.1 /100 | #153 | Good 95.1% |
Demographics Similar to Immigrants from Portugal by 9th Grade
In terms of 9th grade, the demographic groups most similar to Immigrants from Portugal are Immigrants from Caribbean (92.2%, a difference of 0.010%), Vietnamese (92.3%, a difference of 0.040%), Cape Verdean (92.2%, a difference of 0.050%), Houma (92.3%, a difference of 0.060%), and Immigrants from Cuba (92.2%, a difference of 0.060%).
| Demographics | Rating | Rank | 9th Grade |
| Immigrants | Immigrants | 0.0 /100 | #307 | Tragic 92.5% |
| Immigrants | Guyana | 0.0 /100 | #308 | Tragic 92.5% |
| Immigrants | Bangladesh | 0.0 /100 | #309 | Tragic 92.4% |
| Immigrants | Cambodia | 0.0 /100 | #310 | Tragic 92.4% |
| Immigrants | Fiji | 0.0 /100 | #311 | Tragic 92.3% |
| Houma | 0.0 /100 | #312 | Tragic 92.3% |
| Vietnamese | 0.0 /100 | #313 | Tragic 92.3% |
| Immigrants | Portugal | 0.0 /100 | #314 | Tragic 92.2% |
| Immigrants | Caribbean | 0.0 /100 | #315 | Tragic 92.2% |
| Cape Verdeans | 0.0 /100 | #316 | Tragic 92.2% |
| Immigrants | Cuba | 0.0 /100 | #317 | Tragic 92.2% |
| Nepalese | 0.0 /100 | #318 | Tragic 92.0% |
| Ecuadorians | 0.0 /100 | #319 | Tragic 91.9% |
| Nicaraguans | 0.0 /100 | #320 | Tragic 91.9% |
| Immigrants | Ecuador | 0.0 /100 | #321 | Tragic 91.8% |