Immigrants from Sri Lanka vs Danish Professional Degree
COMPARE
Immigrants from Sri Lanka
Danish
Professional Degree
Professional Degree Comparison
Immigrants from Sri Lanka
Danes
6.2%
PROFESSIONAL DEGREE
100.0/ 100
METRIC RATING
29th/ 347
METRIC RANK
4.4%
PROFESSIONAL DEGREE
43.5/ 100
METRIC RATING
181st/ 347
METRIC RANK
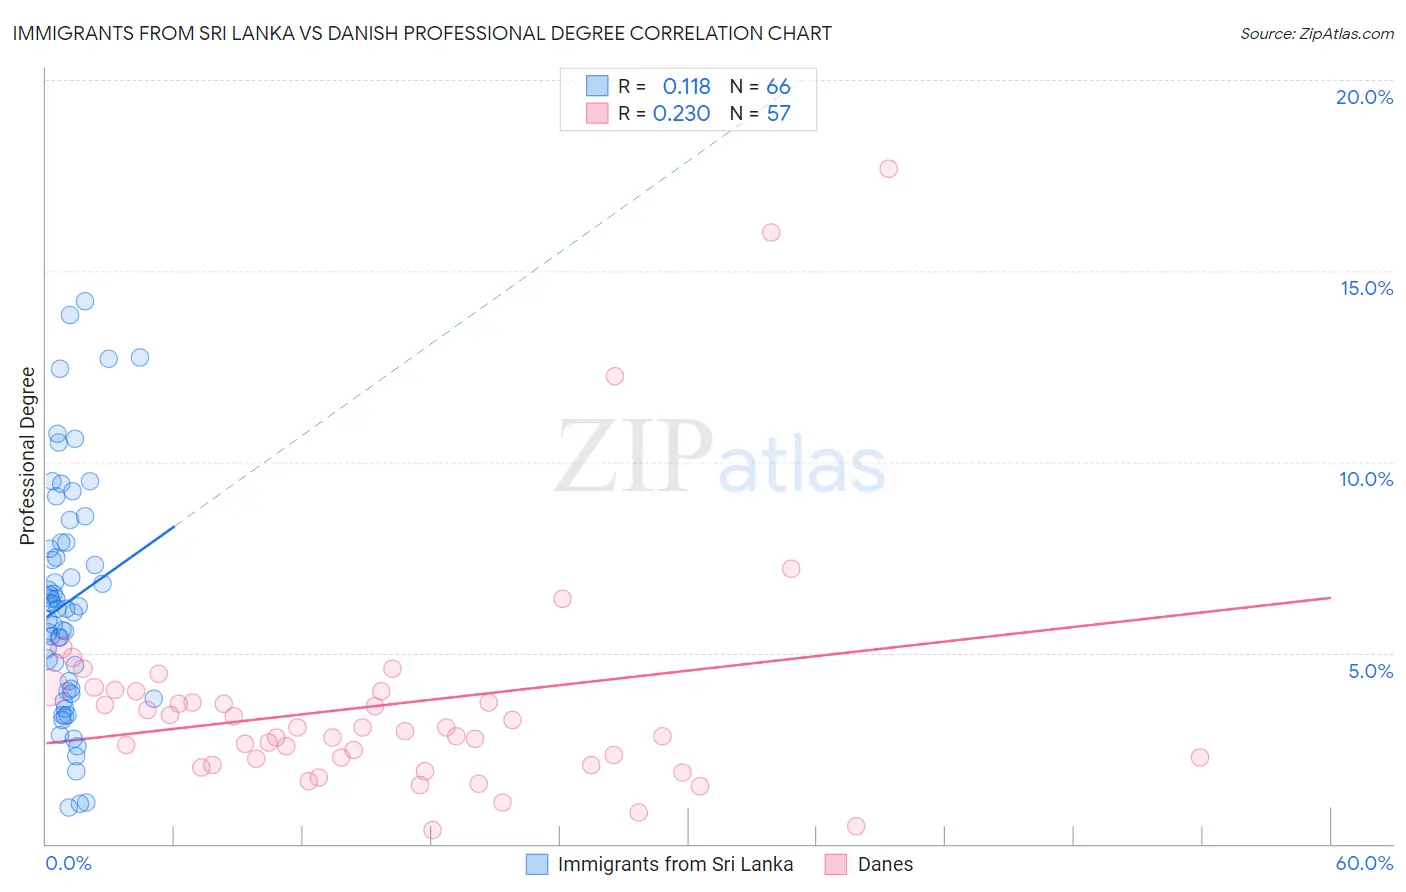
Immigrants from Sri Lanka vs Danish Professional Degree Correlation Chart
The statistical analysis conducted on geographies consisting of 149,679,054 people shows a poor positive correlation between the proportion of Immigrants from Sri Lanka and percentage of population with at least professional degree education in the United States with a correlation coefficient (R) of 0.118 and weighted average of 6.2%. Similarly, the statistical analysis conducted on geographies consisting of 471,556,921 people shows a weak positive correlation between the proportion of Danes and percentage of population with at least professional degree education in the United States with a correlation coefficient (R) of 0.230 and weighted average of 4.4%, a difference of 41.3%.
Professional Degree Correlation Summary
| Measurement | Immigrants from Sri Lanka | Danish |
| Minimum | 0.94% | 0.37% |
| Maximum | 14.2% | 17.7% |
| Range | 13.3% | 17.3% |
| Mean | 6.3% | 3.6% |
| Median | 6.2% | 2.9% |
| Interquartile 25% (IQ1) | 4.0% | 2.1% |
| Interquartile 75% (IQ3) | 7.9% | 4.0% |
| Interquartile Range (IQR) | 3.9% | 1.8% |
| Standard Deviation (Sample) | 3.1% | 3.1% |
| Standard Deviation (Population) | 3.0% | 3.1% |
Similar Demographics by Professional Degree
Demographics Similar to Immigrants from Sri Lanka by Professional Degree
In terms of professional degree, the demographic groups most similar to Immigrants from Sri Lanka are Immigrants from Turkey (6.2%, a difference of 0.0%), Immigrants from India (6.2%, a difference of 0.12%), Thai (6.1%, a difference of 0.35%), Burmese (6.1%, a difference of 0.39%), and Mongolian (6.1%, a difference of 0.52%).
| Demographics | Rating | Rank | Professional Degree |
| Immigrants | Japan | 100.0 /100 | #22 | Exceptional 6.4% |
| Russians | 100.0 /100 | #23 | Exceptional 6.3% |
| Immigrants | Spain | 100.0 /100 | #24 | Exceptional 6.3% |
| Immigrants | Ireland | 100.0 /100 | #25 | Exceptional 6.3% |
| Latvians | 100.0 /100 | #26 | Exceptional 6.2% |
| Immigrants | Northern Europe | 100.0 /100 | #27 | Exceptional 6.2% |
| Turks | 100.0 /100 | #28 | Exceptional 6.2% |
| Immigrants | Sri Lanka | 100.0 /100 | #29 | Exceptional 6.2% |
| Immigrants | Turkey | 100.0 /100 | #30 | Exceptional 6.2% |
| Immigrants | India | 100.0 /100 | #31 | Exceptional 6.2% |
| Thais | 100.0 /100 | #32 | Exceptional 6.1% |
| Burmese | 100.0 /100 | #33 | Exceptional 6.1% |
| Mongolians | 100.0 /100 | #34 | Exceptional 6.1% |
| Immigrants | Korea | 100.0 /100 | #35 | Exceptional 6.1% |
| Immigrants | Russia | 100.0 /100 | #36 | Exceptional 6.0% |
Demographics Similar to Danes by Professional Degree
In terms of professional degree, the demographic groups most similar to Danes are Immigrants (4.4%, a difference of 0.040%), Bermudan (4.4%, a difference of 0.060%), Czech (4.4%, a difference of 0.22%), Immigrants from Kenya (4.4%, a difference of 0.36%), and Immigrants from Costa Rica (4.4%, a difference of 0.47%).
| Demographics | Rating | Rank | Professional Degree |
| Kenyans | 50.0 /100 | #174 | Average 4.4% |
| Irish | 50.0 /100 | #175 | Average 4.4% |
| Immigrants | Peru | 49.3 /100 | #176 | Average 4.4% |
| Celtics | 47.6 /100 | #177 | Average 4.4% |
| Immigrants | Costa Rica | 46.7 /100 | #178 | Average 4.4% |
| Immigrants | Kenya | 45.9 /100 | #179 | Average 4.4% |
| Czechs | 44.9 /100 | #180 | Average 4.4% |
| Danes | 43.5 /100 | #181 | Average 4.4% |
| Immigrants | Immigrants | 43.2 /100 | #182 | Average 4.4% |
| Bermudans | 43.1 /100 | #183 | Average 4.4% |
| Belgians | 36.2 /100 | #184 | Fair 4.3% |
| Welsh | 35.8 /100 | #185 | Fair 4.3% |
| Scotch-Irish | 34.2 /100 | #186 | Fair 4.3% |
| Immigrants | Cameroon | 33.3 /100 | #187 | Fair 4.3% |
| Immigrants | Thailand | 31.7 /100 | #188 | Fair 4.3% |