Immigrants from Southern Europe vs Kenyan Associate's Degree

COMPARE

Immigrants from Southern Europe
Race
Ancestry
AfghanAfricanAlaska NativeAlaskan AthabascanAlbanianAleutAlsatianAmericanApacheArabArapahoArgentineanArmenianAssyrian/Chaldean/SyriacAustralianAustrianBahamianBangladeshiBarbadianBasqueBelgianBelizeanBermudanBhutaneseBlackfeetBolivianBrazilianBritishBritish West IndianBulgarianBurmeseCajunCambodianCanadianCape VerdeanCarpatho RusynCelticCentral AmericanCentral American IndianCherokeeCheyenneChickasawChileanChineseChippewaChoctawColombianColvilleComancheCosta RicanCreeCreekCroatianCrowCubanCypriotCzechCzechoslovakianDanishDelawareDominicanDutchDutch West IndianEastern EuropeanEcuadorianEgyptianEnglishEstonianEthiopianEuropeanFijianFilipinoFinnishFrenchFrench American IndianFrench CanadianGermanGerman RussianGhanaianGreekGuamanian/ChamorroGuatemalanGuyaneseHaitianHmongHonduranHopiHoumaHungarianIcelanderIndian (Asian)IndonesianInupiatIranianIraqiIrishIroquoisIsraeliItalianJamaicanJapaneseJordanianKiowaKoreanLaotianLatvianLebaneseLiberianLithuanianLumbeeLuxembourgerMacedonianMalaysianMalteseMarshalleseMenomineeMexicanMexican American IndianMongolianMoroccanNative HawaiianNavajoNepaleseNew ZealanderNicaraguanNigerianNorthern EuropeanNorwegianOkinawanOsageOttawaPaiutePakistaniPalestinianPanamanianParaguayanPennsylvania GermanPeruvianPimaPolishPortuguesePotawatomiPuebloPuerto RicanPuget Sound SalishRomanianRussianSalvadoranSamoanScandinavianScotch-IrishScottishSeminoleSenegaleseSerbianShoshoneSierra LeoneanSiouxSlavicSlovakSloveneSomaliSouth AfricanSouth AmericanSouth American IndianSoviet UnionSpaniardSpanishSpanish AmericanSpanish American IndianSri LankanSubsaharan AfricanSudaneseSwedishSwissSyrianTaiwaneseThaiTlingit-HaidaTohono O'OdhamTonganTrinidadian and TobagonianTsimshianTurkishU.S. Virgin IslanderUgandanUkrainianUruguayanUteVenezuelanVietnameseWelshWest IndianYakamaYaquiYugoslavianYumanYup'ikZimbabwean
Immigration
NonimmigrantsImmigrantsAfghanistanAfricaAlbaniaArgentinaArmeniaAsiaAustraliaAustriaBahamasBangladeshBarbadosBelarusBelgiumBelizeBoliviaBosnia and HerzegovinaBrazilBulgariaBurma/MyanmarCabo VerdeCambodiaCameroonCanadaCaribbeanCentral AmericaChileChinaColombiaCongoCosta RicaCroatiaCubaCzechoslovakiaDenmarkDominicaDominican RepublicEastern AfricaEastern AsiaEastern EuropeEcuadorEgyptEl SalvadorEnglandEritreaEthiopiaEuropeFijiFranceGermanyGhanaGreeceGrenadaGuatemalaGuyanaHaitiHondurasHong KongHungaryIndiaIndonesiaIranIraqIrelandIsraelItalyJamaicaJapanJordanKazakhstanKenyaKoreaKuwaitLaosLatin AmericaLatviaLebanonLiberiaLithuaniaMalaysiaMexicoMicronesiaMiddle AfricaMoldovaMoroccoNepalNetherlandsNicaraguaNigeriaNorth AmericaNorth MacedoniaNorthern AfricaNorthern EuropeNorwayOceaniaPakistanPanamaPeruPhilippinesPolandPortugalRomaniaRussiaSaudi ArabiaScotlandSenegalSerbiaSierra LeoneSingaporeSomaliaSouth AfricaSouth AmericaSouth Central AsiaSouth Eastern AsiaSouthern EuropeSpainSri LankaSt. Vincent and the GrenadinesSudanSwedenSwitzerlandSyriaTaiwanThailandTrinidad and TobagoTurkeyUgandaUkraineUruguayUzbekistanVenezuelaVietnamWest IndiesWestern AfricaWestern AsiaWestern EuropeYemenZaireZimbabweAzores
Kenyan
Race
Ancestry
AfghanAfricanAlaska NativeAlaskan AthabascanAlbanianAleutAlsatianAmericanApacheArabArapahoArgentineanArmenianAssyrian/Chaldean/SyriacAustralianAustrianBahamianBangladeshiBarbadianBasqueBelgianBelizeanBermudanBhutaneseBlackfeetBolivianBrazilianBritishBritish West IndianBulgarianBurmeseCajunCambodianCanadianCape VerdeanCarpatho RusynCelticCentral AmericanCentral American IndianCherokeeCheyenneChickasawChileanChineseChippewaChoctawColombianColvilleComancheCosta RicanCreeCreekCroatianCrowCubanCypriotCzechCzechoslovakianDanishDelawareDominicanDutchDutch West IndianEastern EuropeanEcuadorianEgyptianEnglishEstonianEthiopianEuropeanFijianFilipinoFinnishFrenchFrench American IndianFrench CanadianGermanGerman RussianGhanaianGreekGuamanian/ChamorroGuatemalanGuyaneseHaitianHmongHonduranHopiHoumaHungarianIcelanderIndian (Asian)IndonesianInupiatIranianIraqiIrishIroquoisIsraeliItalianJamaicanJapaneseJordanianKenyanKiowaKoreanLaotianLatvianLebaneseLiberianLithuanianLumbeeLuxembourgerMacedonianMalaysianMalteseMarshalleseMenomineeMexicanMexican American IndianMongolianMoroccanNative HawaiianNavajoNepaleseNew ZealanderNicaraguanNigerianNorthern EuropeanNorwegianOkinawanOsageOttawaPaiutePakistaniPalestinianPanamanianParaguayanPennsylvania GermanPeruvianPimaPolishPortuguesePotawatomiPuebloPuerto RicanPuget Sound SalishRomanianRussianSalvadoranSamoanScandinavianScotch-IrishScottishSeminoleSenegaleseSerbianShoshoneSierra LeoneanSiouxSlavicSlovakSloveneSomaliSouth AfricanSouth AmericanSouth American IndianSoviet UnionSpaniardSpanishSpanish AmericanSpanish American IndianSri LankanSubsaharan AfricanSudaneseSwedishSwissSyrianTaiwaneseThaiTlingit-HaidaTohono O'OdhamTonganTrinidadian and TobagonianTsimshianTurkishU.S. Virgin IslanderUgandanUkrainianUruguayanUteVenezuelanVietnameseWelshWest IndianYakamaYaquiYugoslavianYumanYup'ikZimbabwean
Immigration
NonimmigrantsImmigrantsAfghanistanAfricaAlbaniaArgentinaArmeniaAsiaAustraliaAustriaBahamasBangladeshBarbadosBelarusBelgiumBelizeBoliviaBosnia and HerzegovinaBrazilBulgariaBurma/MyanmarCabo VerdeCambodiaCameroonCanadaCaribbeanCentral AmericaChileChinaColombiaCongoCosta RicaCroatiaCubaCzechoslovakiaDenmarkDominicaDominican RepublicEastern AfricaEastern AsiaEastern EuropeEcuadorEgyptEl SalvadorEnglandEritreaEthiopiaEuropeFijiFranceGermanyGhanaGreeceGrenadaGuatemalaGuyanaHaitiHondurasHong KongHungaryIndiaIndonesiaIranIraqIrelandIsraelItalyJamaicaJapanJordanKazakhstanKenyaKoreaKuwaitLaosLatin AmericaLatviaLebanonLiberiaLithuaniaMalaysiaMexicoMicronesiaMiddle AfricaMoldovaMoroccoNepalNetherlandsNicaraguaNigeriaNorth AmericaNorth MacedoniaNorthern AfricaNorthern EuropeNorwayOceaniaPakistanPanamaPeruPhilippinesPolandPortugalRomaniaRussiaSaudi ArabiaScotlandSenegalSerbiaSierra LeoneSingaporeSomaliaSouth AfricaSouth AmericaSouth Central AsiaSouth Eastern AsiaSpainSri LankaSt. Vincent and the GrenadinesSudanSwedenSwitzerlandSyriaTaiwanThailandTrinidad and TobagoTurkeyUgandaUkraineUruguayUzbekistanVenezuelaVietnamWest IndiesWestern AfricaWestern AsiaWestern EuropeYemenZaireZimbabweAzores
Associate's Degree
Income
Poverty
Unemployment
Labor Participation
Family Structure
Vehicle Availability
Education Level
Disability

Associate's Degree Comparison

Immigrants from Southern Europe

Kenyans

Excellent
Good
47.8%
ASSOCIATE'S DEGREE
84.4/ 100
METRIC RATING
140th/ 347
METRIC RANK
47.1%
ASSOCIATE'S DEGREE
70.6/ 100
METRIC RATING
155th/ 347
METRIC RANK

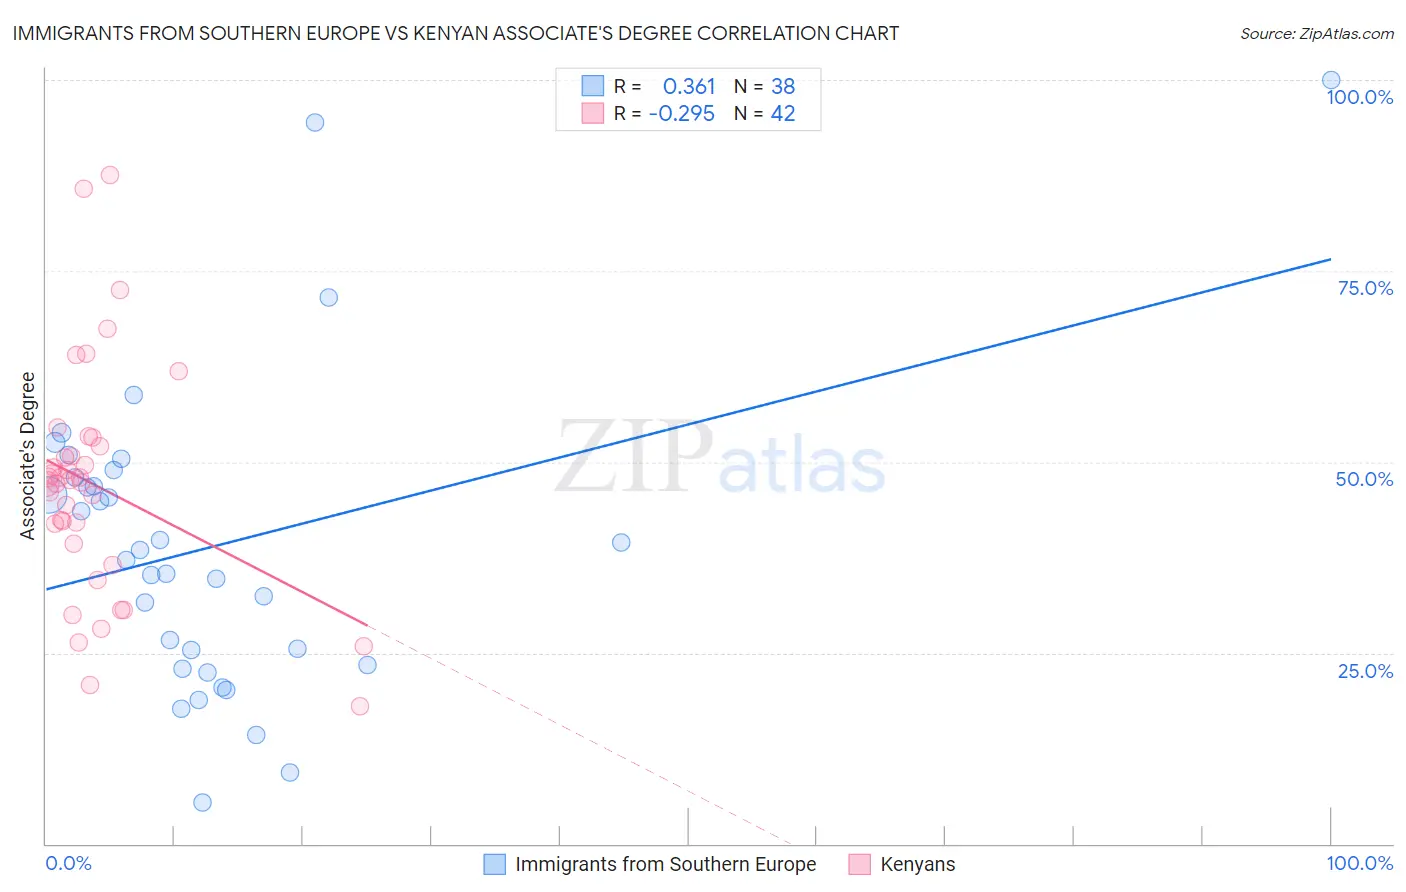
Immigrants from Southern Europe vs Kenyan Associate's Degree Correlation Chart

The statistical analysis conducted on geographies consisting of 402,795,863 people shows a mild positive correlation between the proportion of Immigrants from Southern Europe and percentage of population with at least associate's degree education in the United States with a correlation coefficient (R) of 0.361 and weighted average of 47.8%. Similarly, the statistical analysis conducted on geographies consisting of 168,244,481 people shows a weak negative correlation between the proportion of Kenyans and percentage of population with at least associate's degree education in the United States with a correlation coefficient (R) of -0.295 and weighted average of 47.1%, a difference of 1.5%.
Immigrants from Southern Europe vs Kenyan Associate's Degree

Associate's Degree Correlation Summary

MeasurementImmigrants from Southern EuropeKenyan
Minimum5.4%18.0%
Maximum100.0%87.6%
Range94.6%69.6%
Mean38.9%47.0%
Median37.8%47.5%
Interquartile 25% (IQ1)23.3%39.3%
Interquartile 75% (IQ3)48.0%52.1%
Interquartile Range (IQR)24.7%12.8%
Standard Deviation (Sample)20.1%15.0%
Standard Deviation (Population)19.9%14.8%

Demographics Similar to Immigrants from Southern Europe and Kenyans by Associate's Degree

In terms of associate's degree, the demographic groups most similar to Immigrants from Southern Europe are Slovene (47.9%, a difference of 0.090%), Taiwanese (47.7%, a difference of 0.15%), Sierra Leonean (47.7%, a difference of 0.20%), Norwegian (47.6%, a difference of 0.43%), and Polish (48.0%, a difference of 0.44%). Similarly, the demographic groups most similar to Kenyans are South American (47.1%, a difference of 0.010%), Sudanese (47.1%, a difference of 0.030%), Immigrants from Kenya (47.2%, a difference of 0.13%), Czech (47.2%, a difference of 0.14%), and Immigrants from Afghanistan (47.3%, a difference of 0.33%).
DemographicsRating | RankAssociate's Degree
Immigrants | Eritrea
87.8
/100
|
#137
Excellent
48.1%
Poles
87.3
/100
|
#138
Excellent
48.0%
Slovenes
85.1
/100
|
#139
Excellent
47.9%
Immigrants | Southern Europe
84.4
/100
|
#140
Excellent
47.8%
Taiwanese
83.3
/100
|
#141
Excellent
47.7%
Sierra Leoneans
82.9
/100
|
#142
Excellent
47.7%
Norwegians
81.0
/100
|
#143
Excellent
47.6%
Slavs
80.5
/100
|
#144
Excellent
47.6%
Canadians
79.0
/100
|
#145
Good
47.5%
Immigrants | Sudan
77.9
/100
|
#146
Good
47.4%
Danes
77.3
/100
|
#147
Good
47.4%
South American Indians
76.7
/100
|
#148
Good
47.4%
Immigrants | Armenia
76.6
/100
|
#149
Good
47.4%
Iraqis
76.2
/100
|
#150
Good
47.4%
Immigrants | North Macedonia
76.0
/100
|
#151
Good
47.4%
Immigrants | Afghanistan
74.3
/100
|
#152
Good
47.3%
Czechs
72.2
/100
|
#153
Good
47.2%
Immigrants | Kenya
72.1
/100
|
#154
Good
47.2%
Kenyans
70.6
/100
|
#155
Good
47.1%
South Americans
70.5
/100
|
#156
Good
47.1%
Sudanese
70.3
/100
|
#157
Good
47.1%