Immigrants from Southern Europe vs Immigrants from Sierra Leone 8th Grade
COMPARE
Immigrants from Southern Europe
Immigrants from Sierra Leone
8th Grade
8th Grade Comparison
Immigrants from Southern Europe
Immigrants from Sierra Leone
95.3%
8TH GRADE
7.7/ 100
METRIC RATING
220th/ 347
METRIC RANK
95.1%
8TH GRADE
2.1/ 100
METRIC RATING
239th/ 347
METRIC RANK
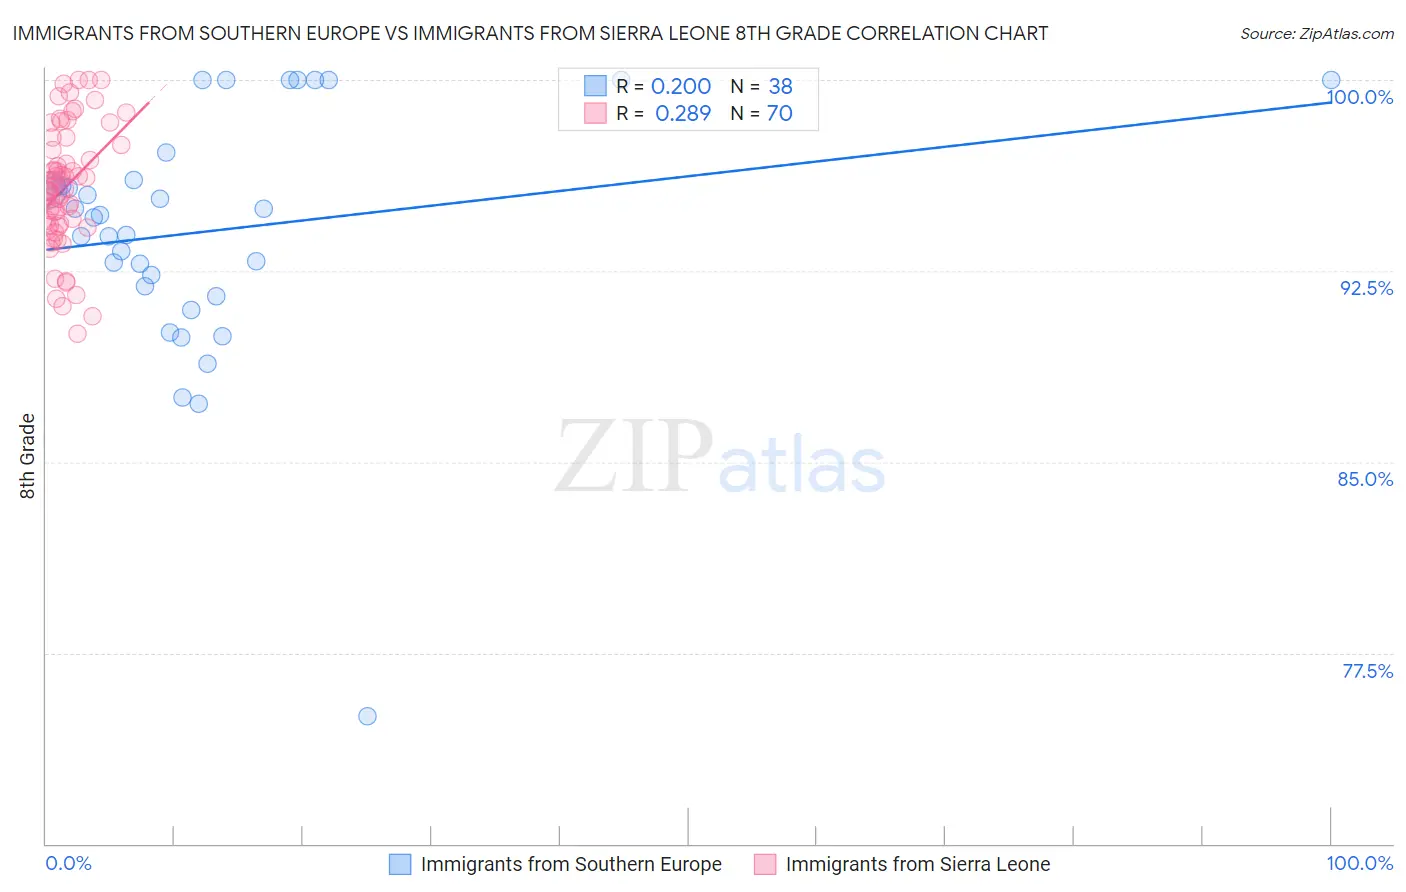
Immigrants from Southern Europe vs Immigrants from Sierra Leone 8th Grade Correlation Chart
The statistical analysis conducted on geographies consisting of 402,804,595 people shows a weak positive correlation between the proportion of Immigrants from Southern Europe and percentage of population with at least 8th grade education in the United States with a correlation coefficient (R) of 0.200 and weighted average of 95.3%. Similarly, the statistical analysis conducted on geographies consisting of 101,634,956 people shows a weak positive correlation between the proportion of Immigrants from Sierra Leone and percentage of population with at least 8th grade education in the United States with a correlation coefficient (R) of 0.289 and weighted average of 95.1%, a difference of 0.22%.
8th Grade Correlation Summary
| Measurement | Immigrants from Southern Europe | Immigrants from Sierra Leone |
| Minimum | 75.0% | 90.0% |
| Maximum | 100.0% | 100.0% |
| Range | 25.0% | 10.0% |
| Mean | 94.1% | 95.8% |
| Median | 94.7% | 95.7% |
| Interquartile 25% (IQ1) | 91.9% | 94.3% |
| Interquartile 75% (IQ3) | 96.1% | 97.5% |
| Interquartile Range (IQR) | 4.2% | 3.2% |
| Standard Deviation (Sample) | 4.9% | 2.4% |
| Standard Deviation (Population) | 4.8% | 2.4% |
Demographics Similar to Immigrants from Southern Europe and Immigrants from Sierra Leone by 8th Grade
In terms of 8th grade, the demographic groups most similar to Immigrants from Southern Europe are Spanish American (95.4%, a difference of 0.010%), Immigrants from Syria (95.3%, a difference of 0.010%), Immigrants from Malaysia (95.3%, a difference of 0.010%), Immigrants from Oceania (95.3%, a difference of 0.010%), and Immigrants from Western Asia (95.3%, a difference of 0.040%). Similarly, the demographic groups most similar to Immigrants from Sierra Leone are Native/Alaskan (95.2%, a difference of 0.020%), Senegalese (95.2%, a difference of 0.040%), Immigrants from Africa (95.2%, a difference of 0.040%), Costa Rican (95.2%, a difference of 0.060%), and Nigerian (95.2%, a difference of 0.060%).
| Demographics | Rating | Rank | 8th Grade |
| Spanish Americans | 8.0 /100 | #219 | Tragic 95.4% |
| Immigrants | Southern Europe | 7.7 /100 | #220 | Tragic 95.3% |
| Immigrants | Syria | 7.4 /100 | #221 | Tragic 95.3% |
| Immigrants | Malaysia | 7.3 /100 | #222 | Tragic 95.3% |
| Immigrants | Oceania | 7.1 /100 | #223 | Tragic 95.3% |
| Immigrants | Western Asia | 6.0 /100 | #224 | Tragic 95.3% |
| Sub-Saharan Africans | 6.0 /100 | #225 | Tragic 95.3% |
| Navajo | 5.7 /100 | #226 | Tragic 95.3% |
| Bahamians | 5.6 /100 | #227 | Tragic 95.3% |
| Immigrants | Eastern Africa | 5.6 /100 | #228 | Tragic 95.3% |
| Immigrants | Indonesia | 4.4 /100 | #229 | Tragic 95.3% |
| Immigrants | Panama | 4.1 /100 | #230 | Tragic 95.2% |
| Asians | 3.5 /100 | #231 | Tragic 95.2% |
| Indians (Asian) | 3.3 /100 | #232 | Tragic 95.2% |
| Immigrants | Asia | 3.1 /100 | #233 | Tragic 95.2% |
| Costa Ricans | 3.0 /100 | #234 | Tragic 95.2% |
| Nigerians | 2.9 /100 | #235 | Tragic 95.2% |
| Senegalese | 2.7 /100 | #236 | Tragic 95.2% |
| Immigrants | Africa | 2.7 /100 | #237 | Tragic 95.2% |
| Natives/Alaskans | 2.3 /100 | #238 | Tragic 95.2% |
| Immigrants | Sierra Leone | 2.1 /100 | #239 | Tragic 95.1% |