Immigrants from South Central Asia vs Immigrants from Romania Associate's Degree

COMPARE

Immigrants from South Central Asia
Race
Ancestry
AfghanAfricanAlaska NativeAlaskan AthabascanAlbanianAleutAlsatianAmericanApacheArabArapahoArgentineanArmenianAssyrian/Chaldean/SyriacAustralianAustrianBahamianBangladeshiBarbadianBasqueBelgianBelizeanBermudanBhutaneseBlackfeetBolivianBrazilianBritishBritish West IndianBulgarianBurmeseCajunCambodianCanadianCape VerdeanCarpatho RusynCelticCentral AmericanCentral American IndianCherokeeCheyenneChickasawChileanChineseChippewaChoctawColombianColvilleComancheCosta RicanCreeCreekCroatianCrowCubanCypriotCzechCzechoslovakianDanishDelawareDominicanDutchDutch West IndianEastern EuropeanEcuadorianEgyptianEnglishEstonianEthiopianEuropeanFijianFilipinoFinnishFrenchFrench American IndianFrench CanadianGermanGerman RussianGhanaianGreekGuamanian/ChamorroGuatemalanGuyaneseHaitianHmongHonduranHopiHoumaHungarianIcelanderIndian (Asian)IndonesianInupiatIranianIraqiIrishIroquoisIsraeliItalianJamaicanJapaneseJordanianKenyanKiowaKoreanLaotianLatvianLebaneseLiberianLithuanianLumbeeLuxembourgerMacedonianMalaysianMalteseMarshalleseMenomineeMexicanMexican American IndianMongolianMoroccanNative HawaiianNavajoNepaleseNew ZealanderNicaraguanNigerianNorthern EuropeanNorwegianOkinawanOsageOttawaPaiutePakistaniPalestinianPanamanianParaguayanPennsylvania GermanPeruvianPimaPolishPortuguesePotawatomiPuebloPuerto RicanPuget Sound SalishRomanianRussianSalvadoranSamoanScandinavianScotch-IrishScottishSeminoleSenegaleseSerbianShoshoneSierra LeoneanSiouxSlavicSlovakSloveneSomaliSouth AfricanSouth AmericanSouth American IndianSoviet UnionSpaniardSpanishSpanish AmericanSpanish American IndianSri LankanSubsaharan AfricanSudaneseSwedishSwissSyrianTaiwaneseThaiTlingit-HaidaTohono O'OdhamTonganTrinidadian and TobagonianTsimshianTurkishU.S. Virgin IslanderUgandanUkrainianUruguayanUteVenezuelanVietnameseWelshWest IndianYakamaYaquiYugoslavianYumanYup'ikZimbabwean
Immigration
NonimmigrantsImmigrantsAfghanistanAfricaAlbaniaArgentinaArmeniaAsiaAustraliaAustriaBahamasBangladeshBarbadosBelarusBelgiumBelizeBoliviaBosnia and HerzegovinaBrazilBulgariaBurma/MyanmarCabo VerdeCambodiaCameroonCanadaCaribbeanCentral AmericaChileChinaColombiaCongoCosta RicaCroatiaCubaCzechoslovakiaDenmarkDominicaDominican RepublicEastern AfricaEastern AsiaEastern EuropeEcuadorEgyptEl SalvadorEnglandEritreaEthiopiaEuropeFijiFranceGermanyGhanaGreeceGrenadaGuatemalaGuyanaHaitiHondurasHong KongHungaryIndiaIndonesiaIranIraqIrelandIsraelItalyJamaicaJapanJordanKazakhstanKenyaKoreaKuwaitLaosLatin AmericaLatviaLebanonLiberiaLithuaniaMalaysiaMexicoMicronesiaMiddle AfricaMoldovaMoroccoNepalNetherlandsNicaraguaNigeriaNorth AmericaNorth MacedoniaNorthern AfricaNorthern EuropeNorwayOceaniaPakistanPanamaPeruPhilippinesPolandPortugalRussiaSaudi ArabiaScotlandSenegalSerbiaSierra LeoneSingaporeSomaliaSouth AfricaSouth AmericaSouth Central AsiaSouth Eastern AsiaSouthern EuropeSpainSri LankaSt. Vincent and the GrenadinesSudanSwedenSwitzerlandSyriaTaiwanThailandTrinidad and TobagoTurkeyUgandaUkraineUruguayUzbekistanVenezuelaVietnamWest IndiesWestern AfricaWestern AsiaWestern EuropeYemenZaireZimbabweAzores
Immigrants from Romania
Race
Ancestry
AfghanAfricanAlaska NativeAlaskan AthabascanAlbanianAleutAlsatianAmericanApacheArabArapahoArgentineanArmenianAssyrian/Chaldean/SyriacAustralianAustrianBahamianBangladeshiBarbadianBasqueBelgianBelizeanBermudanBhutaneseBlackfeetBolivianBrazilianBritishBritish West IndianBulgarianBurmeseCajunCambodianCanadianCape VerdeanCarpatho RusynCelticCentral AmericanCentral American IndianCherokeeCheyenneChickasawChileanChineseChippewaChoctawColombianColvilleComancheCosta RicanCreeCreekCroatianCrowCubanCypriotCzechCzechoslovakianDanishDelawareDominicanDutchDutch West IndianEastern EuropeanEcuadorianEgyptianEnglishEstonianEthiopianEuropeanFijianFilipinoFinnishFrenchFrench American IndianFrench CanadianGermanGerman RussianGhanaianGreekGuamanian/ChamorroGuatemalanGuyaneseHaitianHmongHonduranHopiHoumaHungarianIcelanderIndian (Asian)IndonesianInupiatIranianIraqiIrishIroquoisIsraeliItalianJamaicanJapaneseJordanianKenyanKiowaKoreanLaotianLatvianLebaneseLiberianLithuanianLumbeeLuxembourgerMacedonianMalaysianMalteseMarshalleseMenomineeMexicanMexican American IndianMongolianMoroccanNative HawaiianNavajoNepaleseNew ZealanderNicaraguanNigerianNorthern EuropeanNorwegianOkinawanOsageOttawaPaiutePakistaniPalestinianPanamanianParaguayanPennsylvania GermanPeruvianPimaPolishPortuguesePotawatomiPuebloPuerto RicanPuget Sound SalishRomanianRussianSalvadoranSamoanScandinavianScotch-IrishScottishSeminoleSenegaleseSerbianShoshoneSierra LeoneanSiouxSlavicSlovakSloveneSomaliSouth AfricanSouth AmericanSouth American IndianSoviet UnionSpaniardSpanishSpanish AmericanSpanish American IndianSri LankanSubsaharan AfricanSudaneseSwedishSwissSyrianTaiwaneseThaiTlingit-HaidaTohono O'OdhamTonganTrinidadian and TobagonianTsimshianTurkishU.S. Virgin IslanderUgandanUkrainianUruguayanUteVenezuelanVietnameseWelshWest IndianYakamaYaquiYugoslavianYumanYup'ikZimbabwean
Immigration
NonimmigrantsImmigrantsAfghanistanAfricaAlbaniaArgentinaArmeniaAsiaAustraliaAustriaBahamasBangladeshBarbadosBelarusBelgiumBelizeBoliviaBosnia and HerzegovinaBrazilBulgariaBurma/MyanmarCabo VerdeCambodiaCameroonCanadaCaribbeanCentral AmericaChileChinaColombiaCongoCosta RicaCroatiaCubaCzechoslovakiaDenmarkDominicaDominican RepublicEastern AfricaEastern AsiaEastern EuropeEcuadorEgyptEl SalvadorEnglandEritreaEthiopiaEuropeFijiFranceGermanyGhanaGreeceGrenadaGuatemalaGuyanaHaitiHondurasHong KongHungaryIndiaIndonesiaIranIraqIrelandIsraelItalyJamaicaJapanJordanKazakhstanKenyaKoreaKuwaitLaosLatin AmericaLatviaLebanonLiberiaLithuaniaMalaysiaMexicoMicronesiaMiddle AfricaMoldovaMoroccoNepalNetherlandsNicaraguaNigeriaNorth AmericaNorth MacedoniaNorthern AfricaNorthern EuropeNorwayOceaniaPakistanPanamaPeruPhilippinesPolandPortugalRomaniaRussiaSaudi ArabiaScotlandSenegalSerbiaSierra LeoneSingaporeSomaliaSouth AfricaSouth AmericaSouth Eastern AsiaSouthern EuropeSpainSri LankaSt. Vincent and the GrenadinesSudanSwedenSwitzerlandSyriaTaiwanThailandTrinidad and TobagoTurkeyUgandaUkraineUruguayUzbekistanVenezuelaVietnamWest IndiesWestern AfricaWestern AsiaWestern EuropeYemenZaireZimbabweAzores
Associate's Degree
Income
Poverty
Unemployment
Labor Participation
Family Structure
Vehicle Availability
Education Level
Disability

Associate's Degree Comparison

Immigrants from South Central Asia

Immigrants from Romania

Exceptional
Exceptional
55.7%
ASSOCIATE'S DEGREE
100.0/ 100
METRIC RATING
12th/ 347
METRIC RANK
50.9%
ASSOCIATE'S DEGREE
99.5/ 100
METRIC RATING
71st/ 347
METRIC RANK

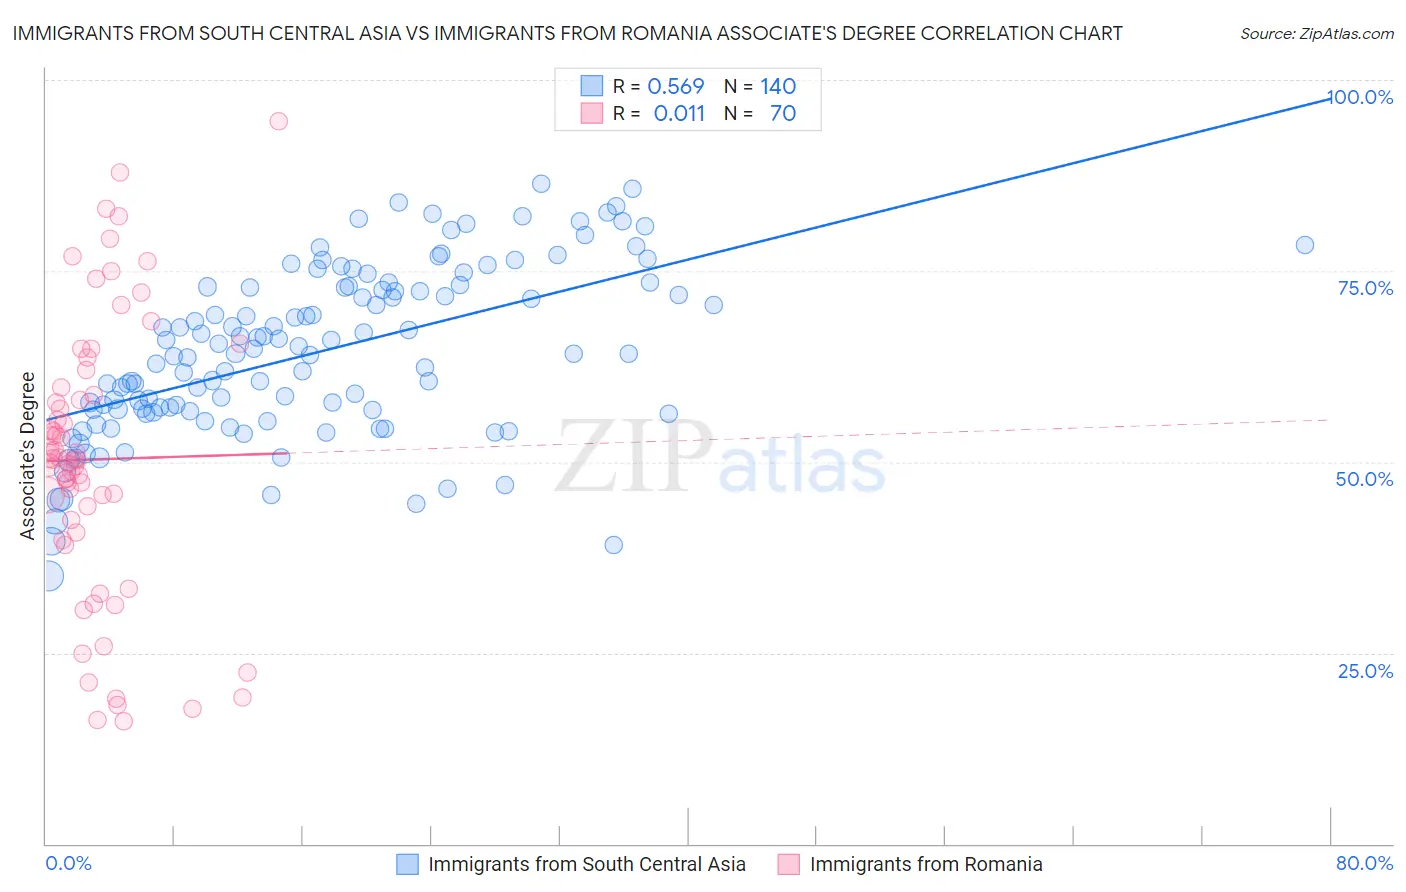
Immigrants from South Central Asia vs Immigrants from Romania Associate's Degree Correlation Chart

The statistical analysis conducted on geographies consisting of 473,063,120 people shows a substantial positive correlation between the proportion of Immigrants from South Central Asia and percentage of population with at least associate's degree education in the United States with a correlation coefficient (R) of 0.569 and weighted average of 55.7%. Similarly, the statistical analysis conducted on geographies consisting of 257,014,107 people shows no correlation between the proportion of Immigrants from Romania and percentage of population with at least associate's degree education in the United States with a correlation coefficient (R) of 0.011 and weighted average of 50.9%, a difference of 9.5%.
Immigrants from South Central Asia vs Immigrants from Romania Associate's Degree

Associate's Degree Correlation Summary

MeasurementImmigrants from South Central AsiaImmigrants from Romania
Minimum35.1%16.1%
Maximum86.5%94.5%
Range51.4%78.4%
Mean64.4%50.3%
Median64.2%50.3%
Interquartile 25% (IQ1)56.7%40.7%
Interquartile 75% (IQ3)72.9%59.7%
Interquartile Range (IQR)16.2%19.1%
Standard Deviation (Sample)11.0%18.2%
Standard Deviation (Population)11.0%18.1%

Similar Demographics by Associate's Degree

Demographics Similar to Immigrants from South Central Asia by Associate's Degree

In terms of associate's degree, the demographic groups most similar to Immigrants from South Central Asia are Immigrants from Australia (55.8%, a difference of 0.12%), Immigrants from China (55.5%, a difference of 0.49%), Immigrants from Hong Kong (55.4%, a difference of 0.63%), Immigrants from Eastern Asia (55.4%, a difference of 0.67%), and Soviet Union (55.1%, a difference of 1.1%).
DemographicsRating | RankAssociate's Degree
Iranians
100.0
/100
|
#5
Exceptional
58.2%
Okinawans
100.0
/100
|
#6
Exceptional
57.7%
Immigrants | Iran
100.0
/100
|
#7
Exceptional
57.7%
Thais
100.0
/100
|
#8
Exceptional
57.4%
Immigrants | Israel
100.0
/100
|
#9
Exceptional
56.8%
Cypriots
100.0
/100
|
#10
Exceptional
56.4%
Immigrants | Australia
100.0
/100
|
#11
Exceptional
55.8%
Immigrants | South Central Asia
100.0
/100
|
#12
Exceptional
55.7%
Immigrants | China
100.0
/100
|
#13
Exceptional
55.5%
Immigrants | Hong Kong
100.0
/100
|
#14
Exceptional
55.4%
Immigrants | Eastern Asia
100.0
/100
|
#15
Exceptional
55.4%
Soviet Union
100.0
/100
|
#16
Exceptional
55.1%
Eastern Europeans
100.0
/100
|
#17
Exceptional
55.0%
Indians (Asian)
100.0
/100
|
#18
Exceptional
54.8%
Immigrants | Ireland
100.0
/100
|
#19
Exceptional
54.7%

Demographics Similar to Immigrants from Romania by Associate's Degree

In terms of associate's degree, the demographic groups most similar to Immigrants from Romania are Immigrants from Argentina (50.9%, a difference of 0.010%), Egyptian (50.9%, a difference of 0.040%), Immigrants from Pakistan (50.9%, a difference of 0.060%), Immigrants from Indonesia (51.0%, a difference of 0.16%), and Carpatho Rusyn (50.6%, a difference of 0.53%).
DemographicsRating | RankAssociate's Degree
Immigrants | Netherlands
99.7
/100
|
#64
Exceptional
51.4%
Zimbabweans
99.7
/100
|
#65
Exceptional
51.3%
Immigrants | Europe
99.7
/100
|
#66
Exceptional
51.3%
Argentineans
99.6
/100
|
#67
Exceptional
51.2%
Immigrants | Indonesia
99.5
/100
|
#68
Exceptional
51.0%
Egyptians
99.5
/100
|
#69
Exceptional
50.9%
Immigrants | Argentina
99.5
/100
|
#70
Exceptional
50.9%
Immigrants | Romania
99.5
/100
|
#71
Exceptional
50.9%
Immigrants | Pakistan
99.5
/100
|
#72
Exceptional
50.9%
Carpatho Rusyns
99.3
/100
|
#73
Exceptional
50.6%
Lithuanians
99.3
/100
|
#74
Exceptional
50.6%
Immigrants | Scotland
99.3
/100
|
#75
Exceptional
50.6%
Immigrants | Zimbabwe
99.2
/100
|
#76
Exceptional
50.5%
Immigrants | Lebanon
99.1
/100
|
#77
Exceptional
50.5%
Immigrants | Eastern Europe
99.1
/100
|
#78
Exceptional
50.5%