Immigrants from South America vs Israeli Associate's Degree
COMPARE
Immigrants from South America
Israeli
Associate's Degree
Associate's Degree Comparison
Immigrants from South America
Israelis
46.7%
ASSOCIATE'S DEGREE
59.9/ 100
METRIC RATING
165th/ 347
METRIC RANK
53.4%
ASSOCIATE'S DEGREE
100.0/ 100
METRIC RATING
33rd/ 347
METRIC RANK
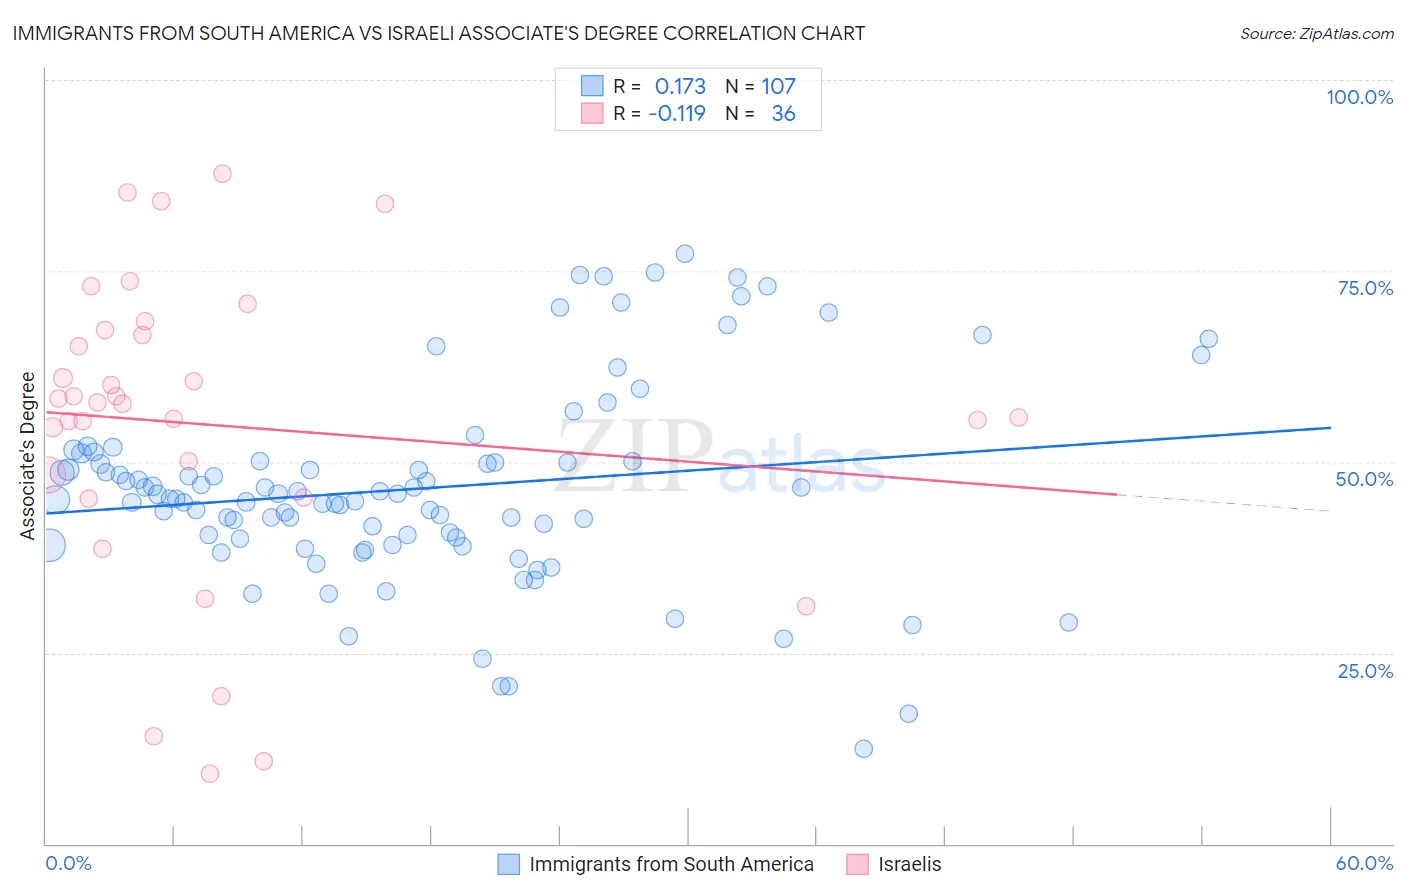
Immigrants from South America vs Israeli Associate's Degree Correlation Chart
The statistical analysis conducted on geographies consisting of 486,384,317 people shows a poor positive correlation between the proportion of Immigrants from South America and percentage of population with at least associate's degree education in the United States with a correlation coefficient (R) of 0.173 and weighted average of 46.7%. Similarly, the statistical analysis conducted on geographies consisting of 211,190,630 people shows a poor negative correlation between the proportion of Israelis and percentage of population with at least associate's degree education in the United States with a correlation coefficient (R) of -0.119 and weighted average of 53.4%, a difference of 14.3%.
Associate's Degree Correlation Summary
| Measurement | Immigrants from South America | Israeli |
| Minimum | 12.4% | 9.1% |
| Maximum | 77.3% | 87.7% |
| Range | 64.9% | 78.6% |
| Mean | 46.5% | 54.8% |
| Median | 45.2% | 57.7% |
| Interquartile 25% (IQ1) | 40.0% | 46.9% |
| Interquartile 75% (IQ3) | 50.0% | 66.9% |
| Interquartile Range (IQR) | 10.0% | 20.0% |
| Standard Deviation (Sample) | 12.9% | 19.9% |
| Standard Deviation (Population) | 12.8% | 19.7% |
Similar Demographics by Associate's Degree
Demographics Similar to Immigrants from South America by Associate's Degree
In terms of associate's degree, the demographic groups most similar to Immigrants from South America are Hungarian (46.7%, a difference of 0.040%), Immigrants from Sierra Leone (46.7%, a difference of 0.050%), Colombian (46.8%, a difference of 0.20%), Somali (46.8%, a difference of 0.21%), and Immigrants from Africa (46.8%, a difference of 0.26%).
| Demographics | Rating | Rank | Associate's Degree |
| Immigrants | Germany | 69.7 /100 | #158 | Good 47.1% |
| Immigrants | Poland | 69.2 /100 | #159 | Good 47.1% |
| Scottish | 65.4 /100 | #160 | Good 46.9% |
| Scandinavians | 65.2 /100 | #161 | Good 46.9% |
| Immigrants | Africa | 63.2 /100 | #162 | Good 46.8% |
| Somalis | 62.5 /100 | #163 | Good 46.8% |
| Colombians | 62.4 /100 | #164 | Good 46.8% |
| Immigrants | South America | 59.9 /100 | #165 | Average 46.7% |
| Hungarians | 59.3 /100 | #166 | Average 46.7% |
| Immigrants | Sierra Leone | 59.2 /100 | #167 | Average 46.7% |
| Immigrants | Somalia | 55.5 /100 | #168 | Average 46.5% |
| Uruguayans | 55.4 /100 | #169 | Average 46.5% |
| Irish | 53.6 /100 | #170 | Average 46.5% |
| Basques | 52.8 /100 | #171 | Average 46.5% |
| Peruvians | 50.5 /100 | #172 | Average 46.4% |
Demographics Similar to Israelis by Associate's Degree
In terms of associate's degree, the demographic groups most similar to Israelis are Immigrants from Turkey (53.4%, a difference of 0.12%), Immigrants from Northern Europe (53.5%, a difference of 0.15%), Bulgarian (53.3%, a difference of 0.19%), Russian (53.2%, a difference of 0.26%), and Immigrants from Sri Lanka (53.7%, a difference of 0.51%).
| Demographics | Rating | Rank | Associate's Degree |
| Immigrants | Belgium | 100.0 /100 | #26 | Exceptional 54.5% |
| Latvians | 100.0 /100 | #27 | Exceptional 53.9% |
| Turks | 100.0 /100 | #28 | Exceptional 53.9% |
| Immigrants | France | 100.0 /100 | #29 | Exceptional 53.9% |
| Immigrants | Sri Lanka | 100.0 /100 | #30 | Exceptional 53.7% |
| Immigrants | Northern Europe | 100.0 /100 | #31 | Exceptional 53.5% |
| Immigrants | Turkey | 100.0 /100 | #32 | Exceptional 53.4% |
| Israelis | 100.0 /100 | #33 | Exceptional 53.4% |
| Bulgarians | 100.0 /100 | #34 | Exceptional 53.3% |
| Russians | 100.0 /100 | #35 | Exceptional 53.2% |
| Immigrants | Russia | 100.0 /100 | #36 | Exceptional 53.1% |
| Immigrants | Denmark | 100.0 /100 | #37 | Exceptional 53.1% |
| Mongolians | 100.0 /100 | #38 | Exceptional 53.0% |
| Immigrants | Belarus | 99.9 /100 | #39 | Exceptional 52.8% |
| Immigrants | Latvia | 99.9 /100 | #40 | Exceptional 52.8% |