Immigrants from South America vs Immigrants from Ireland Kindergarten
COMPARE
Immigrants from South America
Immigrants from Ireland
Kindergarten
Kindergarten Comparison
Immigrants from South America
Immigrants from Ireland
97.5%
KINDERGARTEN
0.4/ 100
METRIC RATING
263rd/ 347
METRIC RANK
98.2%
KINDERGARTEN
97.6/ 100
METRIC RATING
103rd/ 347
METRIC RANK
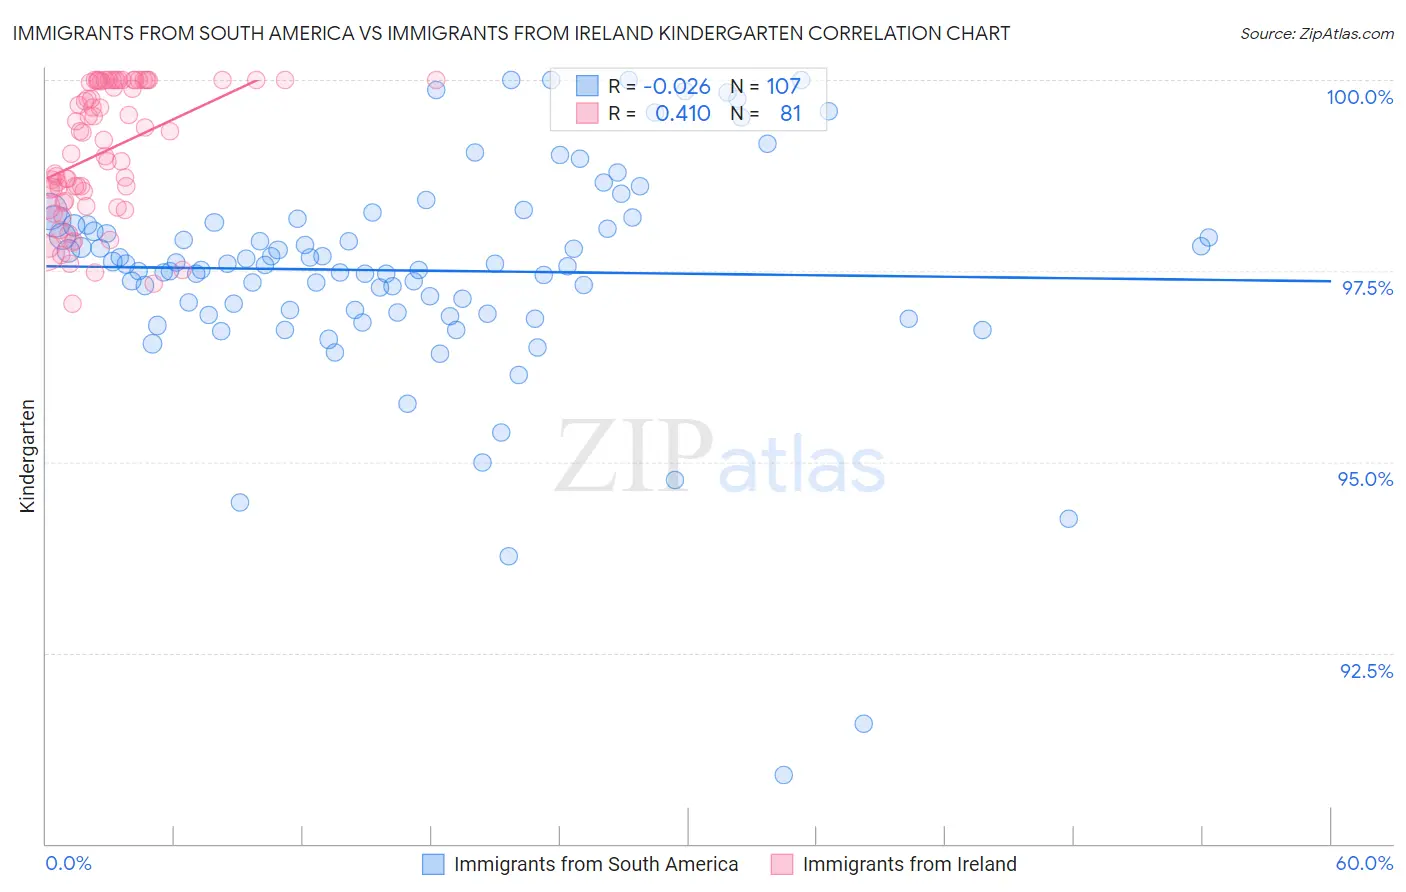
Immigrants from South America vs Immigrants from Ireland Kindergarten Correlation Chart
The statistical analysis conducted on geographies consisting of 486,429,719 people shows no correlation between the proportion of Immigrants from South America and percentage of population with at least kindergarten education in the United States with a correlation coefficient (R) of -0.026 and weighted average of 97.5%. Similarly, the statistical analysis conducted on geographies consisting of 240,784,498 people shows a moderate positive correlation between the proportion of Immigrants from Ireland and percentage of population with at least kindergarten education in the United States with a correlation coefficient (R) of 0.410 and weighted average of 98.2%, a difference of 0.71%.
Kindergarten Correlation Summary
| Measurement | Immigrants from South America | Immigrants from Ireland |
| Minimum | 90.9% | 97.1% |
| Maximum | 100.0% | 100.0% |
| Range | 9.1% | 2.9% |
| Mean | 97.5% | 99.1% |
| Median | 97.6% | 99.2% |
| Interquartile 25% (IQ1) | 97.0% | 98.4% |
| Interquartile 75% (IQ3) | 98.1% | 100.0% |
| Interquartile Range (IQR) | 1.2% | 1.6% |
| Standard Deviation (Sample) | 1.5% | 0.85% |
| Standard Deviation (Population) | 1.5% | 0.85% |
Similar Demographics by Kindergarten
Demographics Similar to Immigrants from South America by Kindergarten
In terms of kindergarten, the demographic groups most similar to Immigrants from South America are Taiwanese (97.5%, a difference of 0.0%), Immigrants from Ethiopia (97.5%, a difference of 0.0%), Assyrian/Chaldean/Syriac (97.5%, a difference of 0.0%), Armenian (97.6%, a difference of 0.010%), and Fijian (97.5%, a difference of 0.010%).
| Demographics | Rating | Rank | Kindergarten |
| Yaqui | 0.7 /100 | #256 | Tragic 97.6% |
| Immigrants | Colombia | 0.6 /100 | #257 | Tragic 97.6% |
| Jamaicans | 0.6 /100 | #258 | Tragic 97.6% |
| Armenians | 0.5 /100 | #259 | Tragic 97.6% |
| Fijians | 0.5 /100 | #260 | Tragic 97.5% |
| Taiwanese | 0.4 /100 | #261 | Tragic 97.5% |
| Immigrants | Ethiopia | 0.4 /100 | #262 | Tragic 97.5% |
| Immigrants | South America | 0.4 /100 | #263 | Tragic 97.5% |
| Assyrians/Chaldeans/Syriacs | 0.4 /100 | #264 | Tragic 97.5% |
| Cubans | 0.3 /100 | #265 | Tragic 97.5% |
| Immigrants | Sierra Leone | 0.3 /100 | #266 | Tragic 97.5% |
| Immigrants | Liberia | 0.3 /100 | #267 | Tragic 97.5% |
| Immigrants | Nigeria | 0.3 /100 | #268 | Tragic 97.5% |
| West Indians | 0.3 /100 | #269 | Tragic 97.5% |
| Immigrants | Jamaica | 0.2 /100 | #270 | Tragic 97.5% |
Demographics Similar to Immigrants from Ireland by Kindergarten
In terms of kindergarten, the demographic groups most similar to Immigrants from Ireland are Cree (98.2%, a difference of 0.0%), Romanian (98.2%, a difference of 0.010%), Bhutanese (98.2%, a difference of 0.010%), Pima (98.2%, a difference of 0.010%), and Basque (98.2%, a difference of 0.010%).
| Demographics | Rating | Rank | Kindergarten |
| Immigrants | Nonimmigrants | 98.3 /100 | #96 | Exceptional 98.3% |
| Cypriots | 98.3 /100 | #97 | Exceptional 98.3% |
| Choctaw | 98.2 /100 | #98 | Exceptional 98.3% |
| Colville | 98.2 /100 | #99 | Exceptional 98.3% |
| Puget Sound Salish | 98.1 /100 | #100 | Exceptional 98.2% |
| Romanians | 97.8 /100 | #101 | Exceptional 98.2% |
| Cree | 97.7 /100 | #102 | Exceptional 98.2% |
| Immigrants | Ireland | 97.6 /100 | #103 | Exceptional 98.2% |
| Bhutanese | 97.3 /100 | #104 | Exceptional 98.2% |
| Pima | 97.3 /100 | #105 | Exceptional 98.2% |
| Basques | 97.3 /100 | #106 | Exceptional 98.2% |
| Turks | 97.3 /100 | #107 | Exceptional 98.2% |
| Immigrants | Switzerland | 97.2 /100 | #108 | Exceptional 98.2% |
| German Russians | 97.1 /100 | #109 | Exceptional 98.2% |
| Immigrants | Singapore | 96.8 /100 | #110 | Exceptional 98.2% |