Immigrants from South Africa vs Kiowa 5th Grade
COMPARE
Immigrants from South Africa
Kiowa
5th Grade
5th Grade Comparison
Immigrants from South Africa
Kiowa
97.8%
5TH GRADE
98.8/ 100
METRIC RATING
89th/ 347
METRIC RANK
97.9%
5TH GRADE
99.5/ 100
METRIC RATING
69th/ 347
METRIC RANK
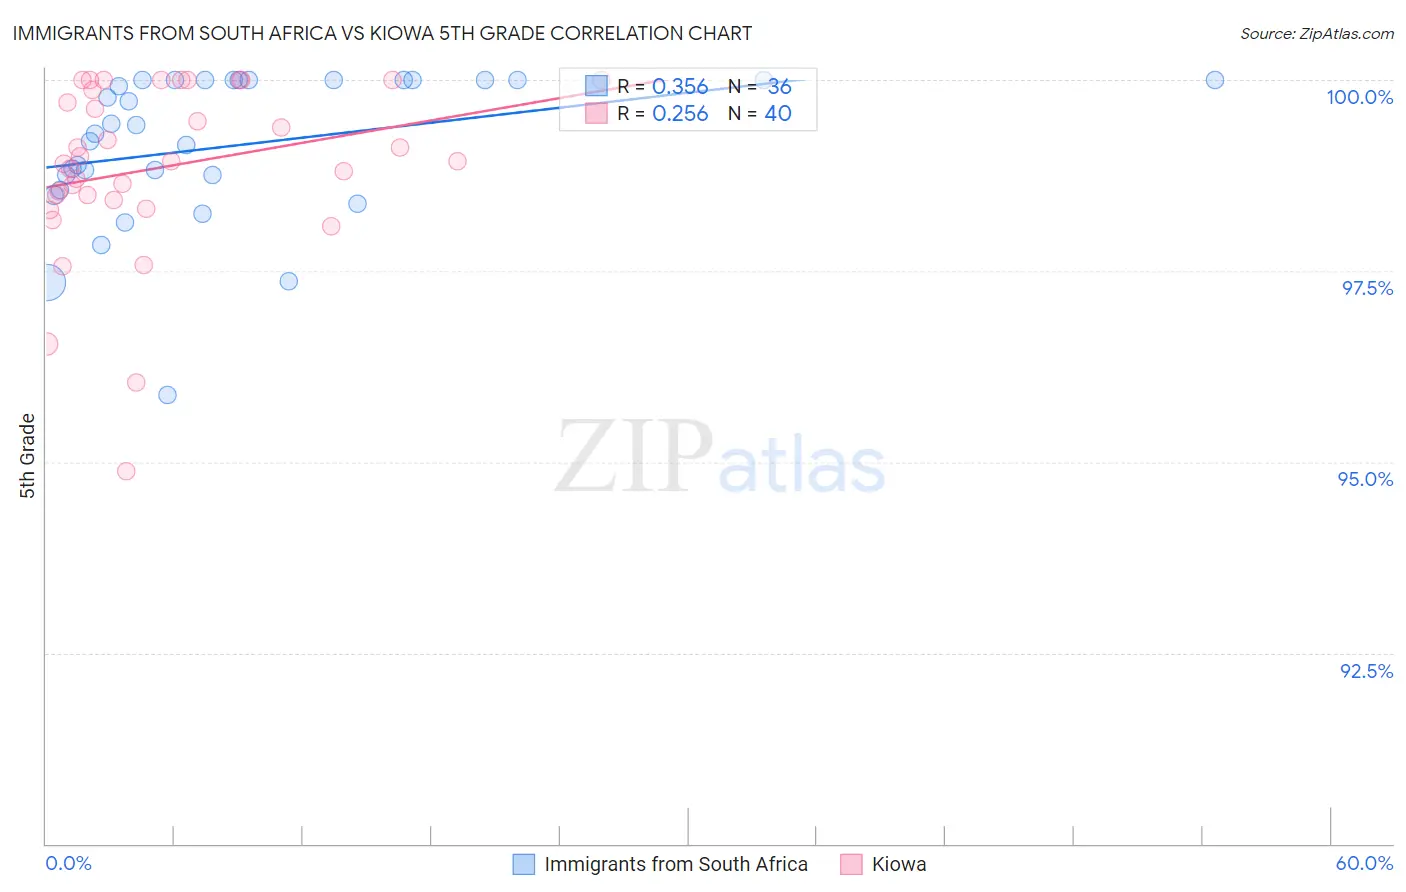
Immigrants from South Africa vs Kiowa 5th Grade Correlation Chart
The statistical analysis conducted on geographies consisting of 233,321,693 people shows a mild positive correlation between the proportion of Immigrants from South Africa and percentage of population with at least 5th grade education in the United States with a correlation coefficient (R) of 0.356 and weighted average of 97.8%. Similarly, the statistical analysis conducted on geographies consisting of 56,100,633 people shows a weak positive correlation between the proportion of Kiowa and percentage of population with at least 5th grade education in the United States with a correlation coefficient (R) of 0.256 and weighted average of 97.9%, a difference of 0.090%.
5th Grade Correlation Summary
| Measurement | Immigrants from South Africa | Kiowa |
| Minimum | 95.9% | 94.9% |
| Maximum | 100.0% | 100.0% |
| Range | 4.1% | 5.1% |
| Mean | 99.1% | 98.9% |
| Median | 99.4% | 98.9% |
| Interquartile 25% (IQ1) | 98.7% | 98.5% |
| Interquartile 75% (IQ3) | 100.0% | 99.9% |
| Interquartile Range (IQR) | 1.3% | 1.5% |
| Standard Deviation (Sample) | 0.98% | 1.1% |
| Standard Deviation (Population) | 0.97% | 1.1% |
Demographics Similar to Immigrants from South Africa and Kiowa by 5th Grade
In terms of 5th grade, the demographic groups most similar to Immigrants from South Africa are Immigrants from Australia (97.8%, a difference of 0.0%), Shoshone (97.8%, a difference of 0.0%), Cypriot (97.8%, a difference of 0.010%), Zimbabwean (97.8%, a difference of 0.020%), and Potawatomi (97.8%, a difference of 0.020%). Similarly, the demographic groups most similar to Kiowa are Iranian (97.9%, a difference of 0.010%), Chickasaw (97.9%, a difference of 0.010%), Macedonian (97.9%, a difference of 0.020%), Cherokee (97.8%, a difference of 0.030%), and Lumbee (97.8%, a difference of 0.040%).
| Demographics | Rating | Rank | 5th Grade |
| Kiowa | 99.5 /100 | #69 | Exceptional 97.9% |
| Iranians | 99.5 /100 | #70 | Exceptional 97.9% |
| Chickasaw | 99.5 /100 | #71 | Exceptional 97.9% |
| Macedonians | 99.4 /100 | #72 | Exceptional 97.9% |
| Cherokee | 99.4 /100 | #73 | Exceptional 97.8% |
| Lumbee | 99.3 /100 | #74 | Exceptional 97.8% |
| Ukrainians | 99.3 /100 | #75 | Exceptional 97.8% |
| Immigrants | Netherlands | 99.3 /100 | #76 | Exceptional 97.8% |
| Immigrants | England | 99.3 /100 | #77 | Exceptional 97.8% |
| Osage | 99.3 /100 | #78 | Exceptional 97.8% |
| Immigrants | Lithuania | 99.2 /100 | #79 | Exceptional 97.8% |
| Immigrants | India | 99.2 /100 | #80 | Exceptional 97.8% |
| Icelanders | 99.2 /100 | #81 | Exceptional 97.8% |
| Pueblo | 99.2 /100 | #82 | Exceptional 97.8% |
| Zimbabweans | 99.0 /100 | #83 | Exceptional 97.8% |
| Potawatomi | 99.0 /100 | #84 | Exceptional 97.8% |
| Immigrants | Belgium | 99.0 /100 | #85 | Exceptional 97.8% |
| Cypriots | 98.9 /100 | #86 | Exceptional 97.8% |
| Immigrants | Australia | 98.8 /100 | #87 | Exceptional 97.8% |
| Shoshone | 98.8 /100 | #88 | Exceptional 97.8% |
| Immigrants | South Africa | 98.8 /100 | #89 | Exceptional 97.8% |