Immigrants from Somalia vs Macedonian 10th Grade
COMPARE
Immigrants from Somalia
Macedonian
10th Grade
10th Grade Comparison
Immigrants from Somalia
Macedonians
93.0%
10TH GRADE
2.7/ 100
METRIC RATING
241st/ 347
METRIC RANK
95.2%
10TH GRADE
99.9/ 100
METRIC RATING
43rd/ 347
METRIC RANK
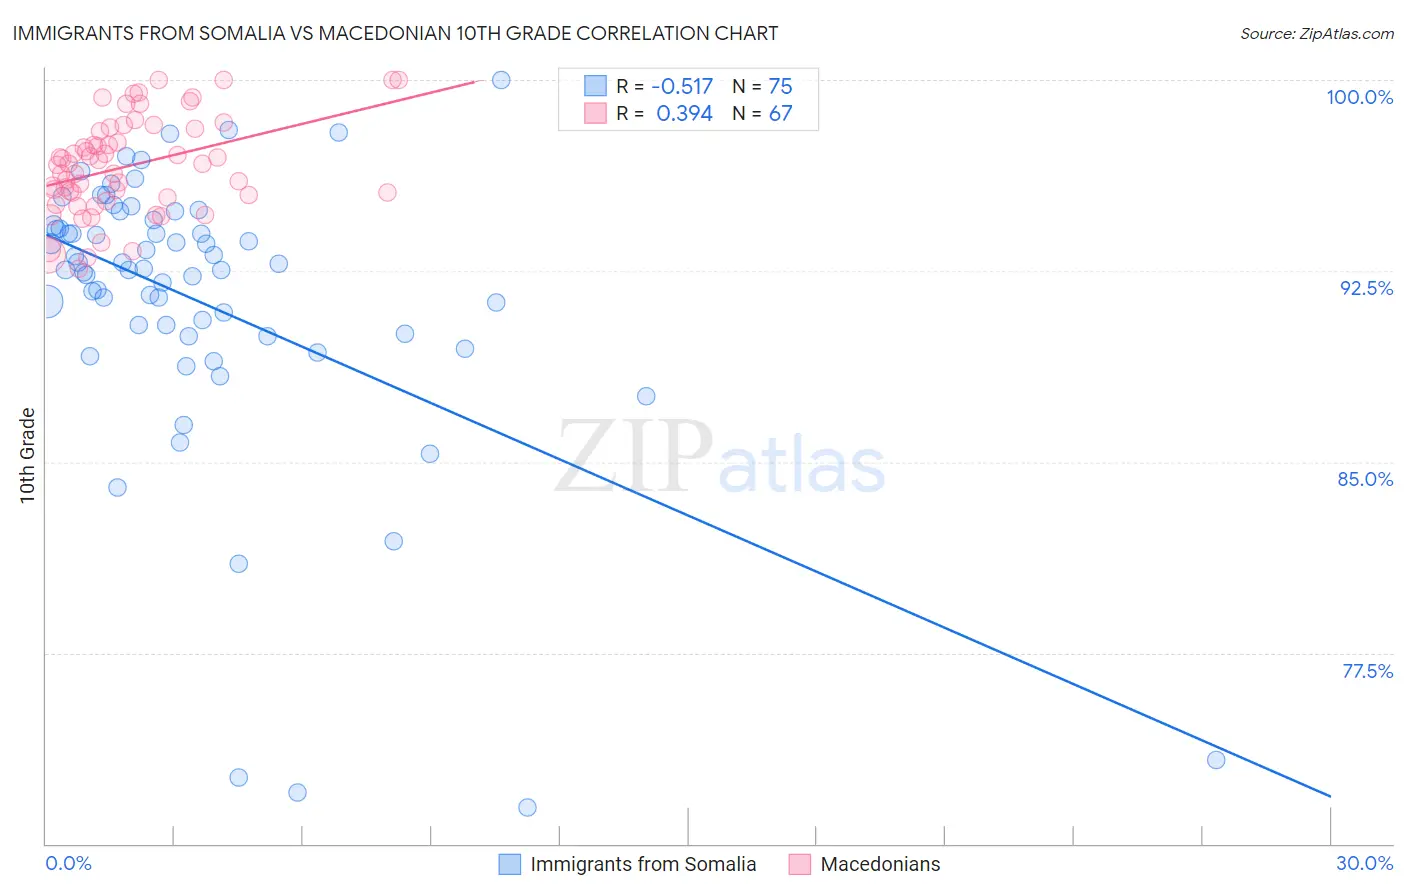
Immigrants from Somalia vs Macedonian 10th Grade Correlation Chart
The statistical analysis conducted on geographies consisting of 92,101,093 people shows a substantial negative correlation between the proportion of Immigrants from Somalia and percentage of population with at least 10th grade education in the United States with a correlation coefficient (R) of -0.517 and weighted average of 93.0%. Similarly, the statistical analysis conducted on geographies consisting of 132,581,663 people shows a mild positive correlation between the proportion of Macedonians and percentage of population with at least 10th grade education in the United States with a correlation coefficient (R) of 0.394 and weighted average of 95.2%, a difference of 2.4%.
10th Grade Correlation Summary
| Measurement | Immigrants from Somalia | Macedonian |
| Minimum | 71.4% | 92.6% |
| Maximum | 100.0% | 100.0% |
| Range | 28.6% | 7.4% |
| Mean | 91.2% | 96.6% |
| Median | 92.6% | 96.7% |
| Interquartile 25% (IQ1) | 89.9% | 95.4% |
| Interquartile 75% (IQ3) | 94.3% | 98.1% |
| Interquartile Range (IQR) | 4.3% | 2.7% |
| Standard Deviation (Sample) | 5.7% | 1.9% |
| Standard Deviation (Population) | 5.7% | 1.9% |
Similar Demographics by 10th Grade
Demographics Similar to Immigrants from Somalia by 10th Grade
In terms of 10th grade, the demographic groups most similar to Immigrants from Somalia are Immigrants from Cameroon (93.0%, a difference of 0.0%), Senegalese (93.0%, a difference of 0.030%), Spanish American (92.9%, a difference of 0.060%), Uruguayan (92.9%, a difference of 0.080%), and Immigrants from Hong Kong (93.1%, a difference of 0.10%).
| Demographics | Rating | Rank | 10th Grade |
| Sub-Saharan Africans | 4.7 /100 | #234 | Tragic 93.1% |
| Africans | 4.6 /100 | #235 | Tragic 93.1% |
| Afghans | 4.5 /100 | #236 | Tragic 93.1% |
| Immigrants | Panama | 4.3 /100 | #237 | Tragic 93.1% |
| Nigerians | 4.2 /100 | #238 | Tragic 93.1% |
| Costa Ricans | 4.2 /100 | #239 | Tragic 93.1% |
| Immigrants | Hong Kong | 4.2 /100 | #240 | Tragic 93.1% |
| Immigrants | Somalia | 2.7 /100 | #241 | Tragic 93.0% |
| Immigrants | Cameroon | 2.6 /100 | #242 | Tragic 93.0% |
| Senegalese | 2.4 /100 | #243 | Tragic 93.0% |
| Spanish Americans | 2.1 /100 | #244 | Tragic 92.9% |
| Uruguayans | 1.8 /100 | #245 | Tragic 92.9% |
| Immigrants | Middle Africa | 1.7 /100 | #246 | Tragic 92.9% |
| Immigrants | Afghanistan | 1.4 /100 | #247 | Tragic 92.8% |
| Colombians | 1.4 /100 | #248 | Tragic 92.8% |
Demographics Similar to Macedonians by 10th Grade
In terms of 10th grade, the demographic groups most similar to Macedonians are Immigrants from Northern Europe (95.2%, a difference of 0.010%), Greek (95.2%, a difference of 0.010%), Slavic (95.2%, a difference of 0.020%), Czechoslovakian (95.1%, a difference of 0.020%), and Serbian (95.1%, a difference of 0.030%).
| Demographics | Rating | Rank | 10th Grade |
| Immigrants | India | 99.9 /100 | #36 | Exceptional 95.3% |
| French Canadians | 99.9 /100 | #37 | Exceptional 95.3% |
| Northern Europeans | 99.9 /100 | #38 | Exceptional 95.3% |
| Immigrants | Scotland | 99.9 /100 | #39 | Exceptional 95.2% |
| Scotch-Irish | 99.9 /100 | #40 | Exceptional 95.2% |
| Russians | 99.9 /100 | #41 | Exceptional 95.2% |
| Slavs | 99.9 /100 | #42 | Exceptional 95.2% |
| Macedonians | 99.9 /100 | #43 | Exceptional 95.2% |
| Immigrants | Northern Europe | 99.9 /100 | #44 | Exceptional 95.2% |
| Greeks | 99.9 /100 | #45 | Exceptional 95.2% |
| Czechoslovakians | 99.9 /100 | #46 | Exceptional 95.1% |
| Serbians | 99.9 /100 | #47 | Exceptional 95.1% |
| Australians | 99.9 /100 | #48 | Exceptional 95.1% |
| Immigrants | Austria | 99.9 /100 | #49 | Exceptional 95.1% |
| Immigrants | Canada | 99.8 /100 | #50 | Exceptional 95.1% |