Immigrants from Singapore vs Soviet Union 2nd Grade

COMPARE

Immigrants from Singapore
Race
Ancestry
AfghanAfricanAlaska NativeAlaskan AthabascanAlbanianAleutAlsatianAmericanApacheArabArapahoArgentineanArmenianAssyrian/Chaldean/SyriacAustralianAustrianBahamianBangladeshiBarbadianBasqueBelgianBelizeanBermudanBhutaneseBlackfeetBolivianBrazilianBritishBritish West IndianBulgarianBurmeseCajunCambodianCanadianCape VerdeanCarpatho RusynCelticCentral AmericanCentral American IndianCherokeeCheyenneChickasawChileanChineseChippewaChoctawColombianColvilleComancheCosta RicanCreeCreekCroatianCrowCubanCypriotCzechCzechoslovakianDanishDelawareDominicanDutchDutch West IndianEastern EuropeanEcuadorianEgyptianEnglishEstonianEthiopianEuropeanFijianFilipinoFinnishFrenchFrench American IndianFrench CanadianGermanGerman RussianGhanaianGreekGuamanian/ChamorroGuatemalanGuyaneseHaitianHmongHonduranHopiHoumaHungarianIcelanderIndian (Asian)IndonesianInupiatIranianIraqiIrishIroquoisIsraeliItalianJamaicanJapaneseJordanianKenyanKiowaKoreanLaotianLatvianLebaneseLiberianLithuanianLumbeeLuxembourgerMacedonianMalaysianMalteseMarshalleseMenomineeMexicanMexican American IndianMongolianMoroccanNative HawaiianNavajoNepaleseNew ZealanderNicaraguanNigerianNorthern EuropeanNorwegianOkinawanOsageOttawaPaiutePakistaniPalestinianPanamanianParaguayanPennsylvania GermanPeruvianPimaPolishPortuguesePotawatomiPuebloPuerto RicanPuget Sound SalishRomanianRussianSalvadoranSamoanScandinavianScotch-IrishScottishSeminoleSenegaleseSerbianShoshoneSierra LeoneanSiouxSlavicSlovakSloveneSomaliSouth AfricanSouth AmericanSouth American IndianSpaniardSpanishSpanish AmericanSpanish American IndianSri LankanSubsaharan AfricanSudaneseSwedishSwissSyrianTaiwaneseThaiTlingit-HaidaTohono O'OdhamTonganTrinidadian and TobagonianTsimshianTurkishU.S. Virgin IslanderUgandanUkrainianUruguayanUteVenezuelanVietnameseWelshWest IndianYakamaYaquiYugoslavianYumanYup'ikZimbabwean
Immigration
NonimmigrantsImmigrantsAfghanistanAfricaAlbaniaArgentinaArmeniaAsiaAustraliaAustriaBahamasBangladeshBarbadosBelarusBelgiumBelizeBoliviaBosnia and HerzegovinaBrazilBulgariaBurma/MyanmarCabo VerdeCambodiaCameroonCanadaCaribbeanCentral AmericaChileChinaColombiaCongoCosta RicaCroatiaCubaCzechoslovakiaDenmarkDominicaDominican RepublicEastern AfricaEastern AsiaEastern EuropeEcuadorEgyptEl SalvadorEnglandEritreaEthiopiaEuropeFijiFranceGermanyGhanaGreeceGrenadaGuatemalaGuyanaHaitiHondurasHong KongHungaryIndiaIndonesiaIranIraqIrelandIsraelItalyJamaicaJapanJordanKazakhstanKenyaKoreaKuwaitLaosLatin AmericaLatviaLebanonLiberiaLithuaniaMalaysiaMexicoMicronesiaMiddle AfricaMoldovaMoroccoNepalNetherlandsNicaraguaNigeriaNorth AmericaNorth MacedoniaNorthern AfricaNorthern EuropeNorwayOceaniaPakistanPanamaPeruPhilippinesPolandPortugalRomaniaRussiaSaudi ArabiaScotlandSenegalSerbiaSierra LeoneSingaporeSomaliaSouth AfricaSouth AmericaSouth Central AsiaSouth Eastern AsiaSouthern EuropeSpainSri LankaSt. Vincent and the GrenadinesSudanSwedenSwitzerlandSyriaTaiwanThailandTrinidad and TobagoTurkeyUgandaUkraineUruguayUzbekistanVenezuelaVietnamWest IndiesWestern AfricaWestern AsiaWestern EuropeYemenZaireZimbabweAzores
Soviet Union
Race
Ancestry
AfghanAfricanAlaska NativeAlaskan AthabascanAlbanianAleutAlsatianAmericanApacheArabArapahoArgentineanArmenianAssyrian/Chaldean/SyriacAustralianAustrianBahamianBangladeshiBarbadianBasqueBelgianBelizeanBermudanBhutaneseBlackfeetBolivianBrazilianBritishBritish West IndianBulgarianBurmeseCajunCambodianCanadianCape VerdeanCarpatho RusynCelticCentral AmericanCentral American IndianCherokeeCheyenneChickasawChileanChineseChippewaChoctawColombianColvilleComancheCosta RicanCreeCreekCroatianCrowCubanCypriotCzechCzechoslovakianDanishDelawareDominicanDutchDutch West IndianEastern EuropeanEcuadorianEgyptianEnglishEstonianEthiopianEuropeanFijianFilipinoFinnishFrenchFrench American IndianFrench CanadianGermanGerman RussianGhanaianGreekGuamanian/ChamorroGuatemalanGuyaneseHaitianHmongHonduranHopiHoumaHungarianIcelanderIndian (Asian)IndonesianInupiatIranianIraqiIrishIroquoisIsraeliItalianJamaicanJapaneseJordanianKenyanKiowaKoreanLaotianLatvianLebaneseLiberianLithuanianLumbeeLuxembourgerMacedonianMalaysianMalteseMarshalleseMenomineeMexicanMexican American IndianMongolianMoroccanNative HawaiianNavajoNepaleseNew ZealanderNicaraguanNigerianNorthern EuropeanNorwegianOkinawanOsageOttawaPaiutePakistaniPalestinianPanamanianParaguayanPennsylvania GermanPeruvianPimaPolishPortuguesePotawatomiPuebloPuerto RicanPuget Sound SalishRomanianRussianSalvadoranSamoanScandinavianScotch-IrishScottishSeminoleSenegaleseSerbianShoshoneSierra LeoneanSiouxSlavicSlovakSloveneSomaliSouth AfricanSouth AmericanSouth American IndianSoviet UnionSpaniardSpanishSpanish AmericanSpanish American IndianSri LankanSubsaharan AfricanSudaneseSwedishSwissSyrianTaiwaneseThaiTlingit-HaidaTohono O'OdhamTonganTrinidadian and TobagonianTsimshianTurkishU.S. Virgin IslanderUgandanUkrainianUruguayanUteVenezuelanVietnameseWelshWest IndianYakamaYaquiYugoslavianYumanYup'ikZimbabwean
Immigration
NonimmigrantsImmigrantsAfghanistanAfricaAlbaniaArgentinaArmeniaAsiaAustraliaAustriaBahamasBangladeshBarbadosBelarusBelgiumBelizeBoliviaBosnia and HerzegovinaBrazilBulgariaBurma/MyanmarCabo VerdeCambodiaCameroonCanadaCaribbeanCentral AmericaChileChinaColombiaCongoCosta RicaCroatiaCubaCzechoslovakiaDenmarkDominicaDominican RepublicEastern AfricaEastern AsiaEastern EuropeEcuadorEgyptEl SalvadorEnglandEritreaEthiopiaEuropeFijiFranceGermanyGhanaGreeceGrenadaGuatemalaGuyanaHaitiHondurasHong KongHungaryIndiaIndonesiaIranIraqIrelandIsraelItalyJamaicaJapanJordanKazakhstanKenyaKoreaKuwaitLaosLatin AmericaLatviaLebanonLiberiaLithuaniaMalaysiaMexicoMicronesiaMiddle AfricaMoldovaMoroccoNepalNetherlandsNicaraguaNigeriaNorth AmericaNorth MacedoniaNorthern AfricaNorthern EuropeNorwayOceaniaPakistanPanamaPeruPhilippinesPolandPortugalRomaniaRussiaSaudi ArabiaScotlandSenegalSerbiaSierra LeoneSomaliaSouth AfricaSouth AmericaSouth Central AsiaSouth Eastern AsiaSouthern EuropeSpainSri LankaSt. Vincent and the GrenadinesSudanSwedenSwitzerlandSyriaTaiwanThailandTrinidad and TobagoTurkeyUgandaUkraineUruguayUzbekistanVenezuelaVietnamWest IndiesWestern AfricaWestern AsiaWestern EuropeYemenZaireZimbabweAzores
2nd Grade
Income
Poverty
Unemployment
Labor Participation
Family Structure
Vehicle Availability
Education Level
Disability

2nd Grade Comparison

Immigrants from Singapore

Soviet Union

Exceptional
Good
98.1%
2ND GRADE
97.0/ 100
METRIC RATING
110th/ 347
METRIC RANK
97.9%
2ND GRADE
70.7/ 100
METRIC RATING
151st/ 347
METRIC RANK

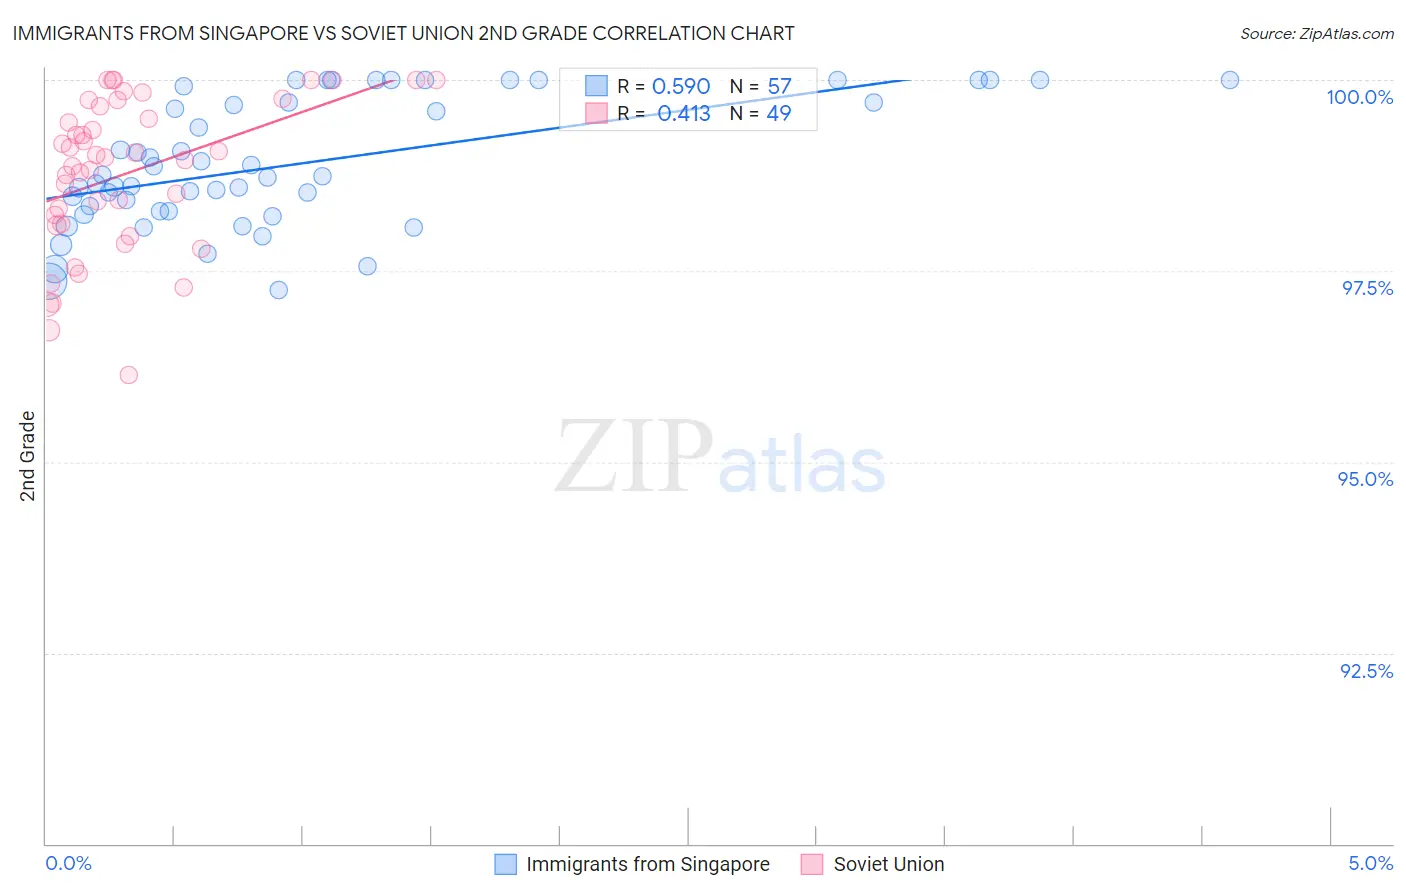
Immigrants from Singapore vs Soviet Union 2nd Grade Correlation Chart

The statistical analysis conducted on geographies consisting of 137,521,700 people shows a substantial positive correlation between the proportion of Immigrants from Singapore and percentage of population with at least 2nd grade education in the United States with a correlation coefficient (R) of 0.590 and weighted average of 98.1%. Similarly, the statistical analysis conducted on geographies consisting of 43,454,395 people shows a moderate positive correlation between the proportion of Soviet Union and percentage of population with at least 2nd grade education in the United States with a correlation coefficient (R) of 0.413 and weighted average of 97.9%, a difference of 0.20%.
Immigrants from Singapore vs Soviet Union 2nd Grade

2nd Grade Correlation Summary

MeasurementImmigrants from SingaporeSoviet Union
Minimum97.2%96.1%
Maximum100.0%100.0%
Range2.8%3.9%
Mean98.9%98.8%
Median98.7%99.0%
Interquartile 25% (IQ1)98.3%98.1%
Interquartile 75% (IQ3)99.8%99.7%
Interquartile Range (IQR)1.5%1.6%
Standard Deviation (Sample)0.83%1.00%
Standard Deviation (Population)0.82%0.99%

Similar Demographics by 2nd Grade

Demographics Similar to Immigrants from Singapore by 2nd Grade

In terms of 2nd grade, the demographic groups most similar to Immigrants from Singapore are Immigrants from Czechoslovakia (98.1%, a difference of 0.0%), Bhutanese (98.1%, a difference of 0.010%), German Russian (98.1%, a difference of 0.010%), Immigrants from Switzerland (98.1%, a difference of 0.010%), and Basque (98.1%, a difference of 0.010%).
DemographicsRating | Rank2nd Grade
Pima
97.6
/100
|
#103
Exceptional
98.2%
Turks
97.6
/100
|
#104
Exceptional
98.2%
Yugoslavians
97.5
/100
|
#105
Exceptional
98.2%
Bhutanese
97.5
/100
|
#106
Exceptional
98.1%
German Russians
97.4
/100
|
#107
Exceptional
98.1%
Immigrants | Switzerland
97.3
/100
|
#108
Exceptional
98.1%
Basques
97.2
/100
|
#109
Exceptional
98.1%
Immigrants | Singapore
97.0
/100
|
#110
Exceptional
98.1%
Immigrants | Czechoslovakia
96.9
/100
|
#111
Exceptional
98.1%
Colville
96.6
/100
|
#112
Exceptional
98.1%
Immigrants | Norway
96.5
/100
|
#113
Exceptional
98.1%
Immigrants | Latvia
96.4
/100
|
#114
Exceptional
98.1%
Iranians
95.9
/100
|
#115
Exceptional
98.1%
Spanish
95.8
/100
|
#116
Exceptional
98.1%
Ute
95.7
/100
|
#117
Exceptional
98.1%

Demographics Similar to Soviet Union by 2nd Grade

In terms of 2nd grade, the demographic groups most similar to Soviet Union are Apache (97.9%, a difference of 0.010%), Immigrants from Moldova (97.9%, a difference of 0.010%), Immigrants from North Macedonia (97.9%, a difference of 0.010%), Immigrants from South Central Asia (97.9%, a difference of 0.010%), and Marshallese (97.9%, a difference of 0.010%).
DemographicsRating | Rank2nd Grade
Hmong
80.0
/100
|
#144
Good
98.0%
Filipinos
79.2
/100
|
#145
Good
98.0%
Immigrants | Israel
78.0
/100
|
#146
Good
98.0%
Immigrants | Greece
76.8
/100
|
#147
Good
98.0%
Jordanians
74.5
/100
|
#148
Good
98.0%
Apache
74.0
/100
|
#149
Good
97.9%
Immigrants | Moldova
72.9
/100
|
#150
Good
97.9%
Soviet Union
70.7
/100
|
#151
Good
97.9%
Immigrants | North Macedonia
68.5
/100
|
#152
Good
97.9%
Immigrants | South Central Asia
68.3
/100
|
#153
Good
97.9%
Marshallese
67.7
/100
|
#154
Good
97.9%
French American Indians
64.3
/100
|
#155
Good
97.9%
Dutch West Indians
63.8
/100
|
#156
Good
97.9%
Venezuelans
63.3
/100
|
#157
Good
97.9%
Immigrants | Iran
62.8
/100
|
#158
Good
97.9%