Immigrants from Singapore vs Czech Doctorate Degree
COMPARE
Immigrants from Singapore
Czech
Doctorate Degree
Doctorate Degree Comparison
Immigrants from Singapore
Czechs
3.7%
DOCTORATE DEGREE
100.0/ 100
METRIC RATING
1st/ 347
METRIC RANK
1.9%
DOCTORATE DEGREE
67.3/ 100
METRIC RATING
163rd/ 347
METRIC RANK
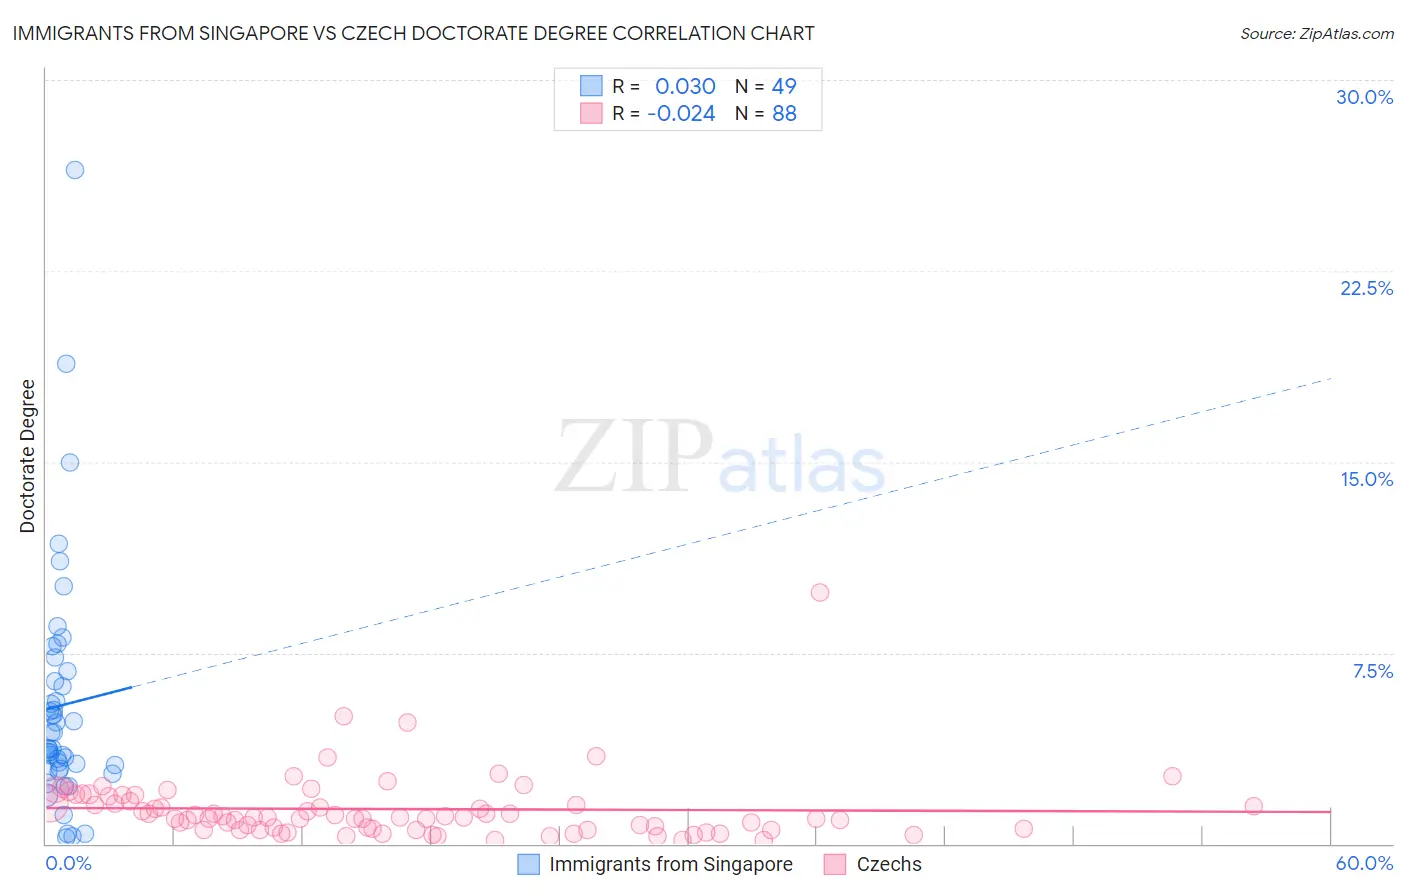
Immigrants from Singapore vs Czech Doctorate Degree Correlation Chart
The statistical analysis conducted on geographies consisting of 137,317,950 people shows no correlation between the proportion of Immigrants from Singapore and percentage of population with at least doctorate degree education in the United States with a correlation coefficient (R) of 0.030 and weighted average of 3.7%. Similarly, the statistical analysis conducted on geographies consisting of 474,197,515 people shows no correlation between the proportion of Czechs and percentage of population with at least doctorate degree education in the United States with a correlation coefficient (R) of -0.024 and weighted average of 1.9%, a difference of 95.1%.
Doctorate Degree Correlation Summary
| Measurement | Immigrants from Singapore | Czech |
| Minimum | 0.22% | 0.13% |
| Maximum | 26.5% | 9.9% |
| Range | 26.3% | 9.7% |
| Mean | 5.4% | 1.4% |
| Median | 3.7% | 1.0% |
| Interquartile 25% (IQ1) | 2.9% | 0.58% |
| Interquartile 75% (IQ3) | 6.6% | 1.8% |
| Interquartile Range (IQR) | 3.7% | 1.2% |
| Standard Deviation (Sample) | 4.8% | 1.3% |
| Standard Deviation (Population) | 4.7% | 1.3% |
Similar Demographics by Doctorate Degree
Demographics Similar to Immigrants from Singapore by Doctorate Degree
In terms of doctorate degree, the demographic groups most similar to Immigrants from Singapore are Filipino (3.4%, a difference of 7.2%), Okinawan (3.3%, a difference of 12.2%), Immigrants from Taiwan (3.2%, a difference of 15.1%), Iranian (3.1%, a difference of 16.9%), and Immigrants from Switzerland (3.1%, a difference of 19.2%).
| Demographics | Rating | Rank | Doctorate Degree |
| Immigrants | Singapore | 100.0 /100 | #1 | Exceptional 3.7% |
| Filipinos | 100.0 /100 | #2 | Exceptional 3.4% |
| Okinawans | 100.0 /100 | #3 | Exceptional 3.3% |
| Immigrants | Taiwan | 100.0 /100 | #4 | Exceptional 3.2% |
| Iranians | 100.0 /100 | #5 | Exceptional 3.1% |
| Immigrants | Switzerland | 100.0 /100 | #6 | Exceptional 3.1% |
| Immigrants | China | 100.0 /100 | #7 | Exceptional 3.1% |
| Immigrants | Israel | 100.0 /100 | #8 | Exceptional 3.0% |
| Immigrants | Iran | 100.0 /100 | #9 | Exceptional 3.0% |
| Immigrants | Eastern Asia | 100.0 /100 | #10 | Exceptional 3.0% |
| Indians (Asian) | 100.0 /100 | #11 | Exceptional 2.9% |
| Immigrants | Belgium | 100.0 /100 | #12 | Exceptional 2.9% |
| Immigrants | Sweden | 100.0 /100 | #13 | Exceptional 2.9% |
| Immigrants | France | 100.0 /100 | #14 | Exceptional 2.9% |
| Immigrants | India | 100.0 /100 | #15 | Exceptional 2.8% |
Demographics Similar to Czechs by Doctorate Degree
In terms of doctorate degree, the demographic groups most similar to Czechs are Irish (1.9%, a difference of 0.040%), Celtic (1.9%, a difference of 0.10%), Immigrants from Middle Africa (1.9%, a difference of 0.25%), Welsh (1.9%, a difference of 0.40%), and Slovene (1.9%, a difference of 0.49%).
| Demographics | Rating | Rank | Doctorate Degree |
| Slavs | 72.4 /100 | #156 | Good 1.9% |
| Danes | 71.9 /100 | #157 | Good 1.9% |
| Hungarians | 71.7 /100 | #158 | Good 1.9% |
| Slovenes | 70.2 /100 | #159 | Good 1.9% |
| Welsh | 69.7 /100 | #160 | Good 1.9% |
| Immigrants | Middle Africa | 68.8 /100 | #161 | Good 1.9% |
| Irish | 67.5 /100 | #162 | Good 1.9% |
| Czechs | 67.3 /100 | #163 | Good 1.9% |
| Celtics | 66.7 /100 | #164 | Good 1.9% |
| Scotch-Irish | 63.6 /100 | #165 | Good 1.9% |
| Spaniards | 63.5 /100 | #166 | Good 1.9% |
| Macedonians | 60.9 /100 | #167 | Good 1.9% |
| Sri Lankans | 60.3 /100 | #168 | Good 1.9% |
| Vietnamese | 54.8 /100 | #169 | Average 1.9% |
| Costa Ricans | 53.3 /100 | #170 | Average 1.8% |