Immigrants from Sierra Leone vs Nicaraguan High School Diploma
COMPARE
Immigrants from Sierra Leone
Nicaraguan
High School Diploma
High School Diploma Comparison
Immigrants from Sierra Leone
Nicaraguans
88.6%
HIGH SCHOOL DIPLOMA
15.8/ 100
METRIC RATING
207th/ 347
METRIC RANK
84.1%
HIGH SCHOOL DIPLOMA
0.0/ 100
METRIC RATING
320th/ 347
METRIC RANK
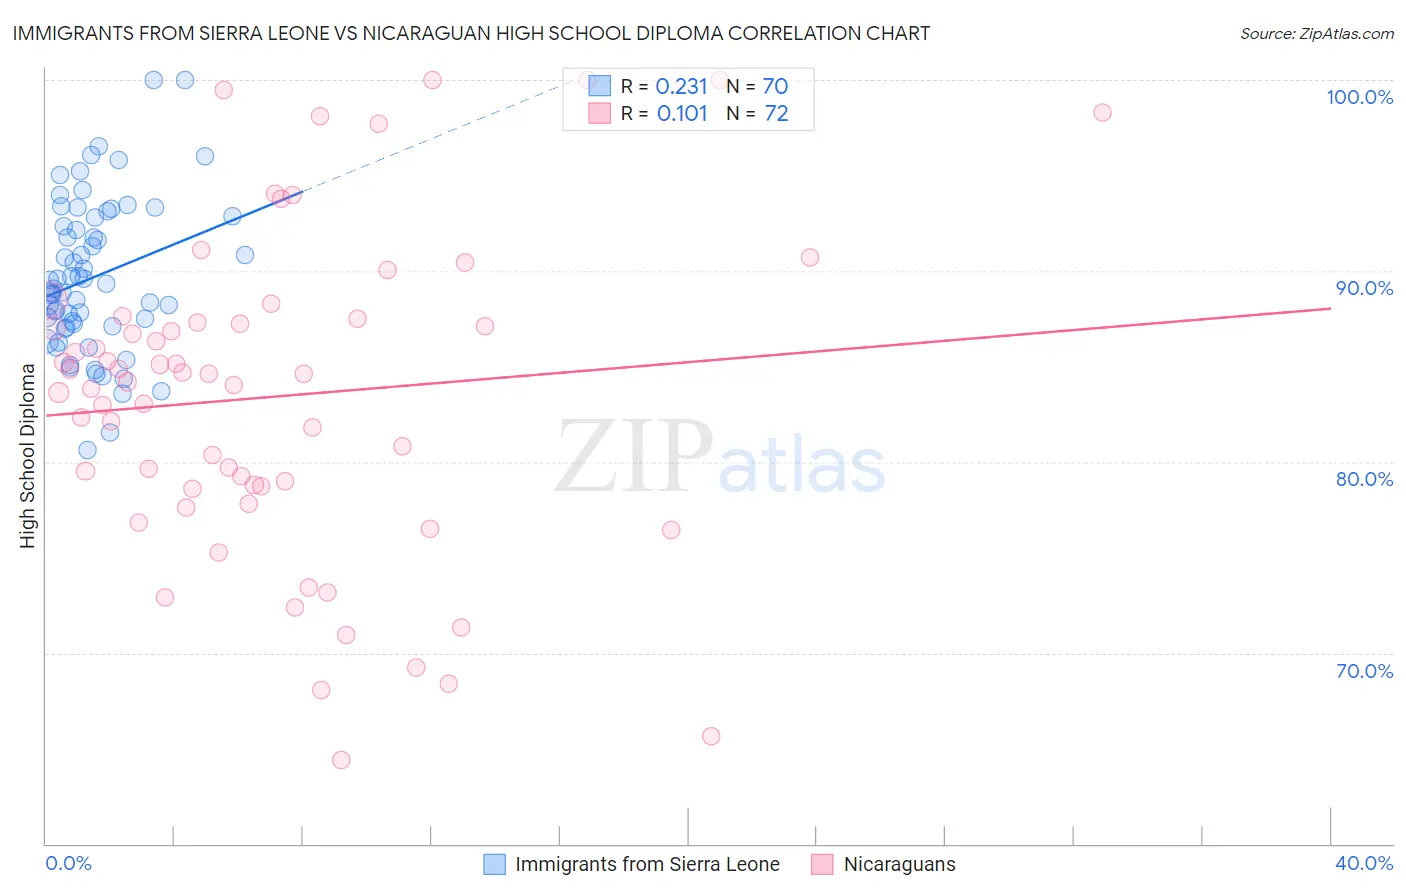
Immigrants from Sierra Leone vs Nicaraguan High School Diploma Correlation Chart
The statistical analysis conducted on geographies consisting of 101,634,956 people shows a weak positive correlation between the proportion of Immigrants from Sierra Leone and percentage of population with at least high school diploma education in the United States with a correlation coefficient (R) of 0.231 and weighted average of 88.6%. Similarly, the statistical analysis conducted on geographies consisting of 285,710,633 people shows a poor positive correlation between the proportion of Nicaraguans and percentage of population with at least high school diploma education in the United States with a correlation coefficient (R) of 0.101 and weighted average of 84.1%, a difference of 5.3%.
High School Diploma Correlation Summary
| Measurement | Immigrants from Sierra Leone | Nicaraguan |
| Minimum | 80.6% | 64.4% |
| Maximum | 100.0% | 100.0% |
| Range | 19.4% | 35.6% |
| Mean | 89.7% | 83.4% |
| Median | 89.2% | 84.4% |
| Interquartile 25% (IQ1) | 87.1% | 78.7% |
| Interquartile 75% (IQ3) | 92.8% | 87.4% |
| Interquartile Range (IQR) | 5.6% | 8.8% |
| Standard Deviation (Sample) | 4.0% | 8.4% |
| Standard Deviation (Population) | 4.0% | 8.3% |
Similar Demographics by High School Diploma
Demographics Similar to Immigrants from Sierra Leone by High School Diploma
In terms of high school diploma, the demographic groups most similar to Immigrants from Sierra Leone are Arapaho (88.6%, a difference of 0.010%), Immigrants from Micronesia (88.6%, a difference of 0.020%), Armenian (88.6%, a difference of 0.040%), Portuguese (88.5%, a difference of 0.040%), and Cherokee (88.5%, a difference of 0.040%).
| Demographics | Rating | Rank | High School Diploma |
| Hawaiians | 18.3 /100 | #200 | Poor 88.6% |
| Koreans | 18.1 /100 | #201 | Poor 88.6% |
| Panamanians | 18.0 /100 | #202 | Poor 88.6% |
| Somalis | 17.5 /100 | #203 | Poor 88.6% |
| Armenians | 17.2 /100 | #204 | Poor 88.6% |
| Immigrants | Micronesia | 16.4 /100 | #205 | Poor 88.6% |
| Arapaho | 16.1 /100 | #206 | Poor 88.6% |
| Immigrants | Sierra Leone | 15.8 /100 | #207 | Poor 88.6% |
| Portuguese | 14.4 /100 | #208 | Poor 88.5% |
| Cherokee | 14.3 /100 | #209 | Poor 88.5% |
| Samoans | 14.0 /100 | #210 | Poor 88.5% |
| Inupiat | 13.1 /100 | #211 | Poor 88.5% |
| South American Indians | 12.2 /100 | #212 | Poor 88.5% |
| Immigrants | Somalia | 11.3 /100 | #213 | Poor 88.4% |
| Immigrants | Cameroon | 10.9 /100 | #214 | Poor 88.4% |
Demographics Similar to Nicaraguans by High School Diploma
In terms of high school diploma, the demographic groups most similar to Nicaraguans are Central American Indian (84.2%, a difference of 0.10%), Immigrants from Belize (84.2%, a difference of 0.14%), Yuman (84.0%, a difference of 0.14%), Immigrants from Caribbean (84.3%, a difference of 0.21%), and Belizean (84.3%, a difference of 0.26%).
| Demographics | Rating | Rank | High School Diploma |
| Immigrants | Ecuador | 0.0 /100 | #313 | Tragic 84.8% |
| Yaqui | 0.0 /100 | #314 | Tragic 84.7% |
| Puerto Ricans | 0.0 /100 | #315 | Tragic 84.7% |
| Belizeans | 0.0 /100 | #316 | Tragic 84.3% |
| Immigrants | Caribbean | 0.0 /100 | #317 | Tragic 84.3% |
| Immigrants | Belize | 0.0 /100 | #318 | Tragic 84.2% |
| Central American Indians | 0.0 /100 | #319 | Tragic 84.2% |
| Nicaraguans | 0.0 /100 | #320 | Tragic 84.1% |
| Yuman | 0.0 /100 | #321 | Tragic 84.0% |
| Lumbee | 0.0 /100 | #322 | Tragic 83.6% |
| Immigrants | Cuba | 0.0 /100 | #323 | Tragic 83.5% |
| Immigrants | Cabo Verde | 0.0 /100 | #324 | Tragic 83.3% |
| Immigrants | Nicaragua | 0.0 /100 | #325 | Tragic 83.1% |
| Mexican American Indians | 0.0 /100 | #326 | Tragic 83.0% |
| Hondurans | 0.0 /100 | #327 | Tragic 83.0% |