Immigrants from Sierra Leone vs Lithuanian 8th Grade

COMPARE

Immigrants from Sierra Leone
Race
Ancestry
AfghanAfricanAlaska NativeAlaskan AthabascanAlbanianAleutAlsatianAmericanApacheArabArapahoArgentineanArmenianAssyrian/Chaldean/SyriacAustralianAustrianBahamianBangladeshiBarbadianBasqueBelgianBelizeanBermudanBhutaneseBlackfeetBolivianBrazilianBritishBritish West IndianBulgarianBurmeseCajunCambodianCanadianCape VerdeanCarpatho RusynCelticCentral AmericanCentral American IndianCherokeeCheyenneChickasawChileanChineseChippewaChoctawColombianColvilleComancheCosta RicanCreeCreekCroatianCrowCubanCypriotCzechCzechoslovakianDanishDelawareDominicanDutchDutch West IndianEastern EuropeanEcuadorianEgyptianEnglishEstonianEthiopianEuropeanFijianFilipinoFinnishFrenchFrench American IndianFrench CanadianGermanGerman RussianGhanaianGreekGuamanian/ChamorroGuatemalanGuyaneseHaitianHmongHonduranHopiHoumaHungarianIcelanderIndian (Asian)IndonesianInupiatIranianIraqiIrishIroquoisIsraeliItalianJamaicanJapaneseJordanianKenyanKiowaKoreanLaotianLatvianLebaneseLiberianLumbeeLuxembourgerMacedonianMalaysianMalteseMarshalleseMenomineeMexicanMexican American IndianMongolianMoroccanNative HawaiianNavajoNepaleseNew ZealanderNicaraguanNigerianNorthern EuropeanNorwegianOkinawanOsageOttawaPaiutePakistaniPalestinianPanamanianParaguayanPennsylvania GermanPeruvianPimaPolishPortuguesePotawatomiPuebloPuerto RicanPuget Sound SalishRomanianRussianSalvadoranSamoanScandinavianScotch-IrishScottishSeminoleSenegaleseSerbianShoshoneSierra LeoneanSiouxSlavicSlovakSloveneSomaliSouth AfricanSouth AmericanSouth American IndianSoviet UnionSpaniardSpanishSpanish AmericanSpanish American IndianSri LankanSubsaharan AfricanSudaneseSwedishSwissSyrianTaiwaneseThaiTlingit-HaidaTohono O'OdhamTonganTrinidadian and TobagonianTsimshianTurkishU.S. Virgin IslanderUgandanUkrainianUruguayanUteVenezuelanVietnameseWelshWest IndianYakamaYaquiYugoslavianYumanYup'ikZimbabwean
Immigration
NonimmigrantsImmigrantsAfghanistanAfricaAlbaniaArgentinaArmeniaAsiaAustraliaAustriaBahamasBangladeshBarbadosBelarusBelgiumBelizeBoliviaBosnia and HerzegovinaBrazilBulgariaBurma/MyanmarCabo VerdeCambodiaCameroonCanadaCaribbeanCentral AmericaChileChinaColombiaCongoCosta RicaCroatiaCubaCzechoslovakiaDenmarkDominicaDominican RepublicEastern AfricaEastern AsiaEastern EuropeEcuadorEgyptEl SalvadorEnglandEritreaEthiopiaEuropeFijiFranceGermanyGhanaGreeceGrenadaGuatemalaGuyanaHaitiHondurasHong KongHungaryIndiaIndonesiaIranIraqIrelandIsraelItalyJamaicaJapanJordanKazakhstanKenyaKoreaKuwaitLaosLatin AmericaLatviaLebanonLiberiaLithuaniaMalaysiaMexicoMicronesiaMiddle AfricaMoldovaMoroccoNepalNetherlandsNicaraguaNigeriaNorth AmericaNorth MacedoniaNorthern AfricaNorthern EuropeNorwayOceaniaPakistanPanamaPeruPhilippinesPolandPortugalRomaniaRussiaSaudi ArabiaScotlandSenegalSerbiaSierra LeoneSingaporeSomaliaSouth AfricaSouth AmericaSouth Central AsiaSouth Eastern AsiaSouthern EuropeSpainSri LankaSt. Vincent and the GrenadinesSudanSwedenSwitzerlandSyriaTaiwanThailandTrinidad and TobagoTurkeyUgandaUkraineUruguayUzbekistanVenezuelaVietnamWest IndiesWestern AfricaWestern AsiaWestern EuropeYemenZaireZimbabweAzores
Lithuanian
Race
Ancestry
AfghanAfricanAlaska NativeAlaskan AthabascanAlbanianAleutAlsatianAmericanApacheArabArapahoArgentineanArmenianAssyrian/Chaldean/SyriacAustralianAustrianBahamianBangladeshiBarbadianBasqueBelgianBelizeanBermudanBhutaneseBlackfeetBolivianBrazilianBritishBritish West IndianBulgarianBurmeseCajunCambodianCanadianCape VerdeanCarpatho RusynCelticCentral AmericanCentral American IndianCherokeeCheyenneChickasawChileanChineseChippewaChoctawColombianColvilleComancheCosta RicanCreeCreekCroatianCrowCubanCypriotCzechCzechoslovakianDanishDelawareDominicanDutchDutch West IndianEastern EuropeanEcuadorianEgyptianEnglishEstonianEthiopianEuropeanFijianFilipinoFinnishFrenchFrench American IndianFrench CanadianGermanGerman RussianGhanaianGreekGuamanian/ChamorroGuatemalanGuyaneseHaitianHmongHonduranHopiHoumaHungarianIcelanderIndian (Asian)IndonesianInupiatIranianIraqiIrishIroquoisIsraeliItalianJamaicanJapaneseJordanianKenyanKiowaKoreanLaotianLatvianLebaneseLiberianLithuanianLumbeeLuxembourgerMacedonianMalaysianMalteseMarshalleseMenomineeMexicanMexican American IndianMongolianMoroccanNative HawaiianNavajoNepaleseNew ZealanderNicaraguanNigerianNorthern EuropeanNorwegianOkinawanOsageOttawaPaiutePakistaniPalestinianPanamanianParaguayanPennsylvania GermanPeruvianPimaPolishPortuguesePotawatomiPuebloPuerto RicanPuget Sound SalishRomanianRussianSalvadoranSamoanScandinavianScotch-IrishScottishSeminoleSenegaleseSerbianShoshoneSierra LeoneanSiouxSlavicSlovakSloveneSomaliSouth AfricanSouth AmericanSouth American IndianSoviet UnionSpaniardSpanishSpanish AmericanSpanish American IndianSri LankanSubsaharan AfricanSudaneseSwedishSwissSyrianTaiwaneseThaiTlingit-HaidaTohono O'OdhamTonganTrinidadian and TobagonianTsimshianTurkishU.S. Virgin IslanderUgandanUkrainianUruguayanUteVenezuelanVietnameseWelshWest IndianYakamaYaquiYugoslavianYumanYup'ikZimbabwean
Immigration
NonimmigrantsImmigrantsAfghanistanAfricaAlbaniaArgentinaArmeniaAsiaAustraliaAustriaBahamasBangladeshBarbadosBelarusBelgiumBelizeBoliviaBosnia and HerzegovinaBrazilBulgariaBurma/MyanmarCabo VerdeCambodiaCameroonCanadaCaribbeanCentral AmericaChileChinaColombiaCongoCosta RicaCroatiaCubaCzechoslovakiaDenmarkDominicaDominican RepublicEastern AfricaEastern AsiaEastern EuropeEcuadorEgyptEl SalvadorEnglandEritreaEthiopiaEuropeFijiFranceGermanyGhanaGreeceGrenadaGuatemalaGuyanaHaitiHondurasHong KongHungaryIndiaIndonesiaIranIraqIrelandIsraelItalyJamaicaJapanJordanKazakhstanKenyaKoreaKuwaitLaosLatin AmericaLatviaLebanonLiberiaLithuaniaMalaysiaMexicoMicronesiaMiddle AfricaMoldovaMoroccoNepalNetherlandsNicaraguaNigeriaNorth AmericaNorth MacedoniaNorthern AfricaNorthern EuropeNorwayOceaniaPakistanPanamaPeruPhilippinesPolandPortugalRomaniaRussiaSaudi ArabiaScotlandSenegalSerbiaSingaporeSomaliaSouth AfricaSouth AmericaSouth Central AsiaSouth Eastern AsiaSouthern EuropeSpainSri LankaSt. Vincent and the GrenadinesSudanSwedenSwitzerlandSyriaTaiwanThailandTrinidad and TobagoTurkeyUgandaUkraineUruguayUzbekistanVenezuelaVietnamWest IndiesWestern AfricaWestern AsiaWestern EuropeYemenZaireZimbabweAzores
8th Grade
Income
Poverty
Unemployment
Labor Participation
Family Structure
Vehicle Availability
Education Level
Disability

8th Grade Comparison

Immigrants from Sierra Leone

Lithuanians

Tragic
Exceptional
95.1%
8TH GRADE
2.1/ 100
METRIC RATING
239th/ 347
METRIC RANK
97.3%
8TH GRADE
100.0/ 100
METRIC RATING
18th/ 347
METRIC RANK

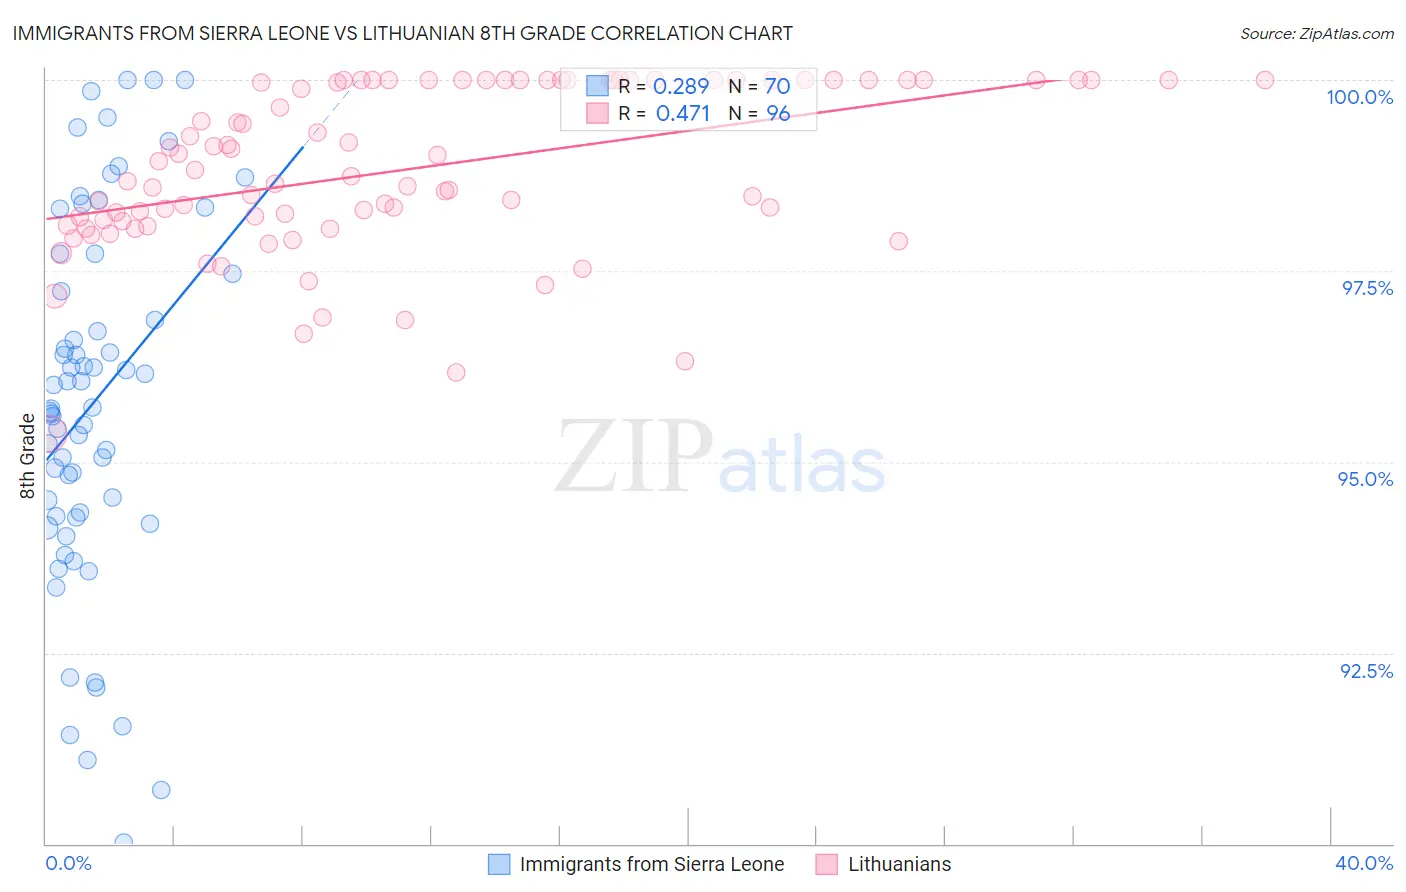
Immigrants from Sierra Leone vs Lithuanian 8th Grade Correlation Chart

The statistical analysis conducted on geographies consisting of 101,634,956 people shows a weak positive correlation between the proportion of Immigrants from Sierra Leone and percentage of population with at least 8th grade education in the United States with a correlation coefficient (R) of 0.289 and weighted average of 95.1%. Similarly, the statistical analysis conducted on geographies consisting of 421,948,041 people shows a moderate positive correlation between the proportion of Lithuanians and percentage of population with at least 8th grade education in the United States with a correlation coefficient (R) of 0.471 and weighted average of 97.3%, a difference of 2.2%.
Immigrants from Sierra Leone vs Lithuanian 8th Grade

8th Grade Correlation Summary

MeasurementImmigrants from Sierra LeoneLithuanian
Minimum90.0%95.4%
Maximum100.0%100.0%
Range10.0%4.6%
Mean95.8%98.8%
Median95.7%98.8%
Interquartile 25% (IQ1)94.3%98.1%
Interquartile 75% (IQ3)97.5%100.0%
Interquartile Range (IQR)3.2%1.9%
Standard Deviation (Sample)2.4%1.1%
Standard Deviation (Population)2.4%1.1%

Similar Demographics by 8th Grade

Demographics Similar to Immigrants from Sierra Leone by 8th Grade

In terms of 8th grade, the demographic groups most similar to Immigrants from Sierra Leone are Ethiopian (95.1%, a difference of 0.0%), South American Indian (95.1%, a difference of 0.010%), Native/Alaskan (95.2%, a difference of 0.020%), Tongan (95.1%, a difference of 0.030%), and Paiute (95.1%, a difference of 0.030%).
DemographicsRating | Rank8th Grade
Indians (Asian)
3.3
/100
|
#232
Tragic
95.2%
Immigrants | Asia
3.1
/100
|
#233
Tragic
95.2%
Costa Ricans
3.0
/100
|
#234
Tragic
95.2%
Nigerians
2.9
/100
|
#235
Tragic
95.2%
Senegalese
2.7
/100
|
#236
Tragic
95.2%
Immigrants | Africa
2.7
/100
|
#237
Tragic
95.2%
Natives/Alaskans
2.3
/100
|
#238
Tragic
95.2%
Immigrants | Sierra Leone
2.1
/100
|
#239
Tragic
95.1%
Ethiopians
2.0
/100
|
#240
Tragic
95.1%
South American Indians
1.9
/100
|
#241
Tragic
95.1%
Tongans
1.7
/100
|
#242
Tragic
95.1%
Paiute
1.7
/100
|
#243
Tragic
95.1%
Immigrants | Middle Africa
1.7
/100
|
#244
Tragic
95.1%
Jamaicans
1.4
/100
|
#245
Tragic
95.1%
Somalis
1.4
/100
|
#246
Tragic
95.1%

Demographics Similar to Lithuanians by 8th Grade

In terms of 8th grade, the demographic groups most similar to Lithuanians are Irish (97.3%, a difference of 0.010%), Scottish (97.3%, a difference of 0.010%), Tlingit-Haida (97.3%, a difference of 0.020%), Pennsylvania German (97.3%, a difference of 0.050%), and Alaskan Athabascan (97.3%, a difference of 0.060%).
DemographicsRating | Rank8th Grade
Poles
100.0
/100
|
#11
Exceptional
97.4%
Swedes
100.0
/100
|
#12
Exceptional
97.4%
Alaskan Athabascans
100.0
/100
|
#13
Exceptional
97.3%
English
100.0
/100
|
#14
Exceptional
97.3%
Pennsylvania Germans
100.0
/100
|
#15
Exceptional
97.3%
Tlingit-Haida
100.0
/100
|
#16
Exceptional
97.3%
Irish
100.0
/100
|
#17
Exceptional
97.3%
Lithuanians
100.0
/100
|
#18
Exceptional
97.3%
Scottish
100.0
/100
|
#19
Exceptional
97.3%
Croatians
100.0
/100
|
#20
Exceptional
97.2%
Danes
100.0
/100
|
#21
Exceptional
97.2%
Welsh
100.0
/100
|
#22
Exceptional
97.2%
French Canadians
100.0
/100
|
#23
Exceptional
97.2%
Scandinavians
100.0
/100
|
#24
Exceptional
97.2%
Czechs
100.0
/100
|
#25
Exceptional
97.1%