Immigrants from Sierra Leone vs Immigrants from Scotland 10th Grade
COMPARE
Immigrants from Sierra Leone
Immigrants from Scotland
10th Grade
10th Grade Comparison
Immigrants from Sierra Leone
Immigrants from Scotland
93.2%
10TH GRADE
7.6/ 100
METRIC RATING
223rd/ 347
METRIC RANK
95.2%
10TH GRADE
99.9/ 100
METRIC RATING
39th/ 347
METRIC RANK
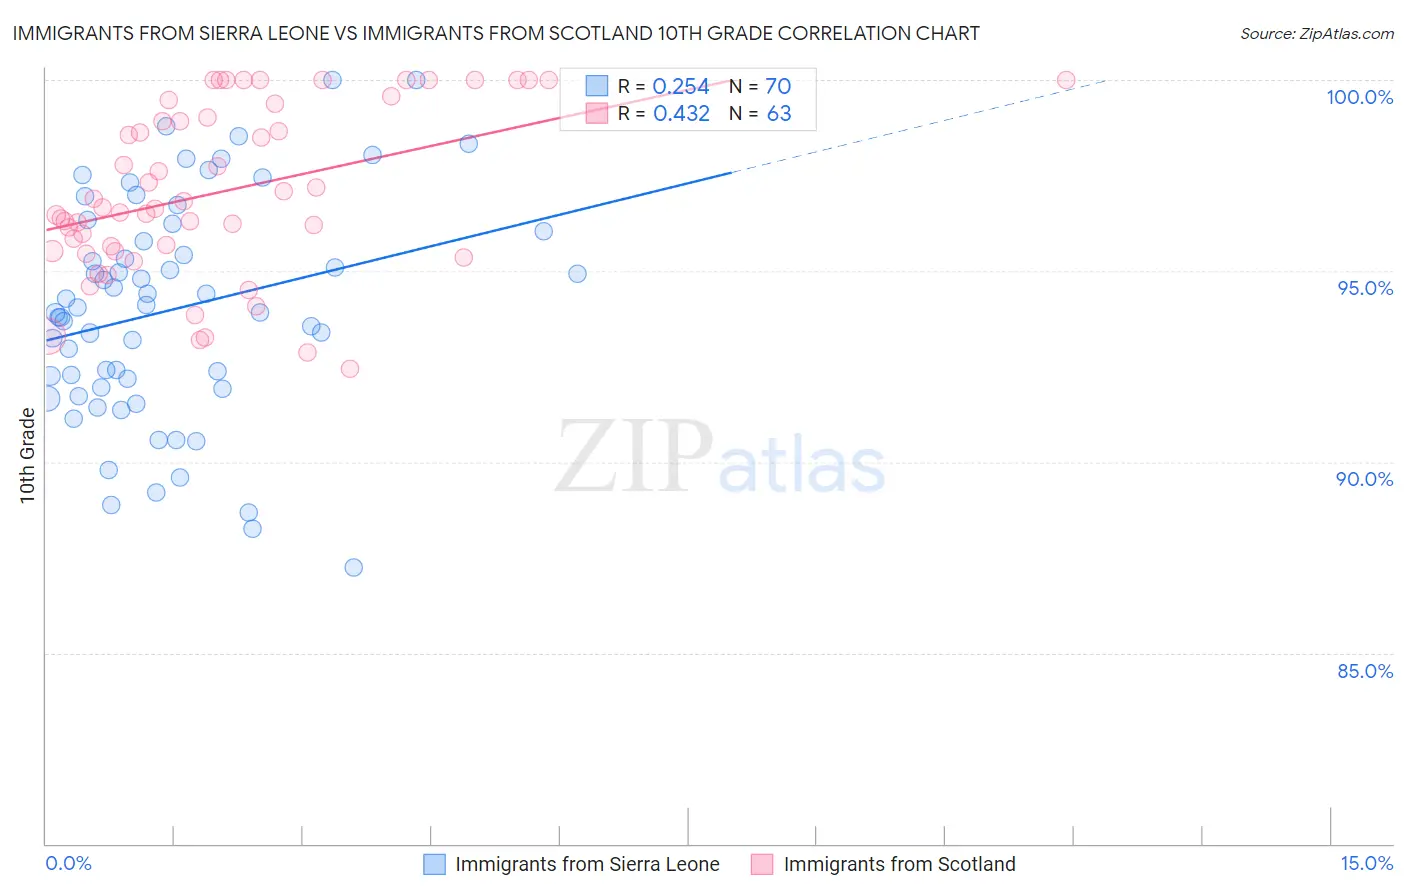
Immigrants from Sierra Leone vs Immigrants from Scotland 10th Grade Correlation Chart
The statistical analysis conducted on geographies consisting of 101,634,956 people shows a weak positive correlation between the proportion of Immigrants from Sierra Leone and percentage of population with at least 10th grade education in the United States with a correlation coefficient (R) of 0.254 and weighted average of 93.2%. Similarly, the statistical analysis conducted on geographies consisting of 196,394,967 people shows a moderate positive correlation between the proportion of Immigrants from Scotland and percentage of population with at least 10th grade education in the United States with a correlation coefficient (R) of 0.432 and weighted average of 95.2%, a difference of 2.2%.
10th Grade Correlation Summary
| Measurement | Immigrants from Sierra Leone | Immigrants from Scotland |
| Minimum | 87.2% | 92.4% |
| Maximum | 100.0% | 100.0% |
| Range | 12.8% | 7.6% |
| Mean | 94.0% | 97.1% |
| Median | 94.0% | 96.7% |
| Interquartile 25% (IQ1) | 91.9% | 95.5% |
| Interquartile 75% (IQ3) | 96.1% | 99.4% |
| Interquartile Range (IQR) | 4.1% | 3.8% |
| Standard Deviation (Sample) | 2.9% | 2.2% |
| Standard Deviation (Population) | 2.9% | 2.2% |
Similar Demographics by 10th Grade
Demographics Similar to Immigrants from Sierra Leone by 10th Grade
In terms of 10th grade, the demographic groups most similar to Immigrants from Sierra Leone are Ethiopian (93.2%, a difference of 0.010%), Bolivian (93.2%, a difference of 0.030%), Immigrants from Southern Europe (93.2%, a difference of 0.040%), Tongan (93.3%, a difference of 0.050%), and Somali (93.2%, a difference of 0.050%).
| Demographics | Rating | Rank | 10th Grade |
| Immigrants | Eastern Africa | 14.7 /100 | #216 | Poor 93.4% |
| Portuguese | 12.1 /100 | #217 | Poor 93.3% |
| Immigrants | Liberia | 10.2 /100 | #218 | Poor 93.3% |
| Seminole | 10.2 /100 | #219 | Poor 93.3% |
| Tongans | 9.5 /100 | #220 | Tragic 93.3% |
| Immigrants | Southern Europe | 8.9 /100 | #221 | Tragic 93.2% |
| Ethiopians | 7.9 /100 | #222 | Tragic 93.2% |
| Immigrants | Sierra Leone | 7.6 /100 | #223 | Tragic 93.2% |
| Bolivians | 6.7 /100 | #224 | Tragic 93.2% |
| Somalis | 6.2 /100 | #225 | Tragic 93.2% |
| Koreans | 6.1 /100 | #226 | Tragic 93.2% |
| Blacks/African Americans | 6.0 /100 | #227 | Tragic 93.2% |
| Immigrants | China | 5.9 /100 | #228 | Tragic 93.2% |
| Immigrants | Ethiopia | 5.1 /100 | #229 | Tragic 93.1% |
| Immigrants | Africa | 5.0 /100 | #230 | Tragic 93.1% |
Demographics Similar to Immigrants from Scotland by 10th Grade
In terms of 10th grade, the demographic groups most similar to Immigrants from Scotland are Scotch-Irish (95.2%, a difference of 0.0%), Northern European (95.3%, a difference of 0.020%), Russian (95.2%, a difference of 0.030%), French Canadian (95.3%, a difference of 0.060%), and Slavic (95.2%, a difference of 0.060%).
| Demographics | Rating | Rank | 10th Grade |
| Hungarians | 100.0 /100 | #32 | Exceptional 95.3% |
| French | 100.0 /100 | #33 | Exceptional 95.3% |
| British | 99.9 /100 | #34 | Exceptional 95.3% |
| Estonians | 99.9 /100 | #35 | Exceptional 95.3% |
| Immigrants | India | 99.9 /100 | #36 | Exceptional 95.3% |
| French Canadians | 99.9 /100 | #37 | Exceptional 95.3% |
| Northern Europeans | 99.9 /100 | #38 | Exceptional 95.3% |
| Immigrants | Scotland | 99.9 /100 | #39 | Exceptional 95.2% |
| Scotch-Irish | 99.9 /100 | #40 | Exceptional 95.2% |
| Russians | 99.9 /100 | #41 | Exceptional 95.2% |
| Slavs | 99.9 /100 | #42 | Exceptional 95.2% |
| Macedonians | 99.9 /100 | #43 | Exceptional 95.2% |
| Immigrants | Northern Europe | 99.9 /100 | #44 | Exceptional 95.2% |
| Greeks | 99.9 /100 | #45 | Exceptional 95.2% |
| Czechoslovakians | 99.9 /100 | #46 | Exceptional 95.1% |