Immigrants from Serbia vs New Zealander 1st Grade

COMPARE

Immigrants from Serbia
Race
Ancestry
AfghanAfricanAlaska NativeAlaskan AthabascanAlbanianAleutAlsatianAmericanApacheArabArapahoArgentineanArmenianAssyrian/Chaldean/SyriacAustralianAustrianBahamianBangladeshiBarbadianBasqueBelgianBelizeanBermudanBhutaneseBlackfeetBolivianBrazilianBritishBritish West IndianBulgarianBurmeseCajunCambodianCanadianCape VerdeanCarpatho RusynCelticCentral AmericanCentral American IndianCherokeeCheyenneChickasawChileanChineseChippewaChoctawColombianColvilleComancheCosta RicanCreeCreekCroatianCrowCubanCypriotCzechCzechoslovakianDanishDelawareDominicanDutchDutch West IndianEastern EuropeanEcuadorianEgyptianEnglishEstonianEthiopianEuropeanFijianFilipinoFinnishFrenchFrench American IndianFrench CanadianGermanGerman RussianGhanaianGreekGuamanian/ChamorroGuatemalanGuyaneseHaitianHmongHonduranHopiHoumaHungarianIcelanderIndian (Asian)IndonesianInupiatIranianIraqiIrishIroquoisIsraeliItalianJamaicanJapaneseJordanianKenyanKiowaKoreanLaotianLatvianLebaneseLiberianLithuanianLumbeeLuxembourgerMacedonianMalaysianMalteseMarshalleseMenomineeMexicanMexican American IndianMongolianMoroccanNative HawaiianNavajoNepaleseNicaraguanNigerianNorthern EuropeanNorwegianOkinawanOsageOttawaPaiutePakistaniPalestinianPanamanianParaguayanPennsylvania GermanPeruvianPimaPolishPortuguesePotawatomiPuebloPuerto RicanPuget Sound SalishRomanianRussianSalvadoranSamoanScandinavianScotch-IrishScottishSeminoleSenegaleseSerbianShoshoneSierra LeoneanSiouxSlavicSlovakSloveneSomaliSouth AfricanSouth AmericanSouth American IndianSoviet UnionSpaniardSpanishSpanish AmericanSpanish American IndianSri LankanSubsaharan AfricanSudaneseSwedishSwissSyrianTaiwaneseThaiTlingit-HaidaTohono O'OdhamTonganTrinidadian and TobagonianTsimshianTurkishU.S. Virgin IslanderUgandanUkrainianUruguayanUteVenezuelanVietnameseWelshWest IndianYakamaYaquiYugoslavianYumanYup'ikZimbabwean
Immigration
NonimmigrantsImmigrantsAfghanistanAfricaAlbaniaArgentinaArmeniaAsiaAustraliaAustriaBahamasBangladeshBarbadosBelarusBelgiumBelizeBoliviaBosnia and HerzegovinaBrazilBulgariaBurma/MyanmarCabo VerdeCambodiaCameroonCanadaCaribbeanCentral AmericaChileChinaColombiaCongoCosta RicaCroatiaCubaCzechoslovakiaDenmarkDominicaDominican RepublicEastern AfricaEastern AsiaEastern EuropeEcuadorEgyptEl SalvadorEnglandEritreaEthiopiaEuropeFijiFranceGermanyGhanaGreeceGrenadaGuatemalaGuyanaHaitiHondurasHong KongHungaryIndiaIndonesiaIranIraqIrelandIsraelItalyJamaicaJapanJordanKazakhstanKenyaKoreaKuwaitLaosLatin AmericaLatviaLebanonLiberiaLithuaniaMalaysiaMexicoMicronesiaMiddle AfricaMoldovaMoroccoNepalNetherlandsNicaraguaNigeriaNorth AmericaNorth MacedoniaNorthern AfricaNorthern EuropeNorwayOceaniaPakistanPanamaPeruPhilippinesPolandPortugalRomaniaRussiaSaudi ArabiaScotlandSenegalSerbiaSierra LeoneSingaporeSomaliaSouth AfricaSouth AmericaSouth Central AsiaSouth Eastern AsiaSouthern EuropeSpainSri LankaSt. Vincent and the GrenadinesSudanSwedenSwitzerlandSyriaTaiwanThailandTrinidad and TobagoTurkeyUgandaUkraineUruguayUzbekistanVenezuelaVietnamWest IndiesWestern AfricaWestern AsiaWestern EuropeYemenZaireZimbabweAzores
New Zealander
Race
Ancestry
AfghanAfricanAlaska NativeAlaskan AthabascanAlbanianAleutAlsatianAmericanApacheArabArapahoArgentineanArmenianAssyrian/Chaldean/SyriacAustralianAustrianBahamianBangladeshiBarbadianBasqueBelgianBelizeanBermudanBhutaneseBlackfeetBolivianBrazilianBritishBritish West IndianBulgarianBurmeseCajunCambodianCanadianCape VerdeanCarpatho RusynCelticCentral AmericanCentral American IndianCherokeeCheyenneChickasawChileanChineseChippewaChoctawColombianColvilleComancheCosta RicanCreeCreekCroatianCrowCubanCypriotCzechCzechoslovakianDanishDelawareDominicanDutchDutch West IndianEastern EuropeanEcuadorianEgyptianEnglishEstonianEthiopianEuropeanFijianFilipinoFinnishFrenchFrench American IndianFrench CanadianGermanGerman RussianGhanaianGreekGuamanian/ChamorroGuatemalanGuyaneseHaitianHmongHonduranHopiHoumaHungarianIcelanderIndian (Asian)IndonesianInupiatIranianIraqiIrishIroquoisIsraeliItalianJamaicanJapaneseJordanianKenyanKiowaKoreanLaotianLatvianLebaneseLiberianLithuanianLumbeeLuxembourgerMacedonianMalaysianMalteseMarshalleseMenomineeMexicanMexican American IndianMongolianMoroccanNative HawaiianNavajoNepaleseNew ZealanderNicaraguanNigerianNorthern EuropeanNorwegianOkinawanOsageOttawaPaiutePakistaniPalestinianPanamanianParaguayanPennsylvania GermanPeruvianPimaPolishPortuguesePotawatomiPuebloPuerto RicanPuget Sound SalishRomanianRussianSalvadoranSamoanScandinavianScotch-IrishScottishSeminoleSenegaleseSerbianShoshoneSierra LeoneanSiouxSlavicSlovakSloveneSomaliSouth AfricanSouth AmericanSouth American IndianSoviet UnionSpaniardSpanishSpanish AmericanSpanish American IndianSri LankanSubsaharan AfricanSudaneseSwedishSwissSyrianTaiwaneseThaiTlingit-HaidaTohono O'OdhamTonganTrinidadian and TobagonianTsimshianTurkishU.S. Virgin IslanderUgandanUkrainianUruguayanUteVenezuelanVietnameseWelshWest IndianYakamaYaquiYugoslavianYumanYup'ikZimbabwean
Immigration
NonimmigrantsImmigrantsAfghanistanAfricaAlbaniaArgentinaArmeniaAsiaAustraliaAustriaBahamasBangladeshBarbadosBelarusBelgiumBelizeBoliviaBosnia and HerzegovinaBrazilBulgariaBurma/MyanmarCabo VerdeCambodiaCameroonCanadaCaribbeanCentral AmericaChileChinaColombiaCongoCosta RicaCroatiaCubaCzechoslovakiaDenmarkDominicaDominican RepublicEastern AfricaEastern AsiaEastern EuropeEcuadorEgyptEl SalvadorEnglandEritreaEthiopiaEuropeFijiFranceGermanyGhanaGreeceGrenadaGuatemalaGuyanaHaitiHondurasHong KongHungaryIndiaIndonesiaIranIraqIrelandIsraelItalyJamaicaJapanJordanKazakhstanKenyaKoreaKuwaitLaosLatin AmericaLatviaLebanonLiberiaLithuaniaMalaysiaMexicoMicronesiaMiddle AfricaMoldovaMoroccoNepalNetherlandsNicaraguaNigeriaNorth AmericaNorth MacedoniaNorthern AfricaNorthern EuropeNorwayOceaniaPakistanPanamaPeruPhilippinesPolandPortugalRomaniaRussiaSaudi ArabiaScotlandSenegalSierra LeoneSingaporeSomaliaSouth AfricaSouth AmericaSouth Central AsiaSouth Eastern AsiaSouthern EuropeSpainSri LankaSt. Vincent and the GrenadinesSudanSwedenSwitzerlandSyriaTaiwanThailandTrinidad and TobagoTurkeyUgandaUkraineUruguayUzbekistanVenezuelaVietnamWest IndiesWestern AfricaWestern AsiaWestern EuropeYemenZaireZimbabweAzores
1st Grade
Income
Poverty
Unemployment
Labor Participation
Family Structure
Vehicle Availability
Education Level
Disability

1st Grade Comparison

Immigrants from Serbia

New Zealanders

Exceptional
Exceptional
98.1%
1ST GRADE
92.2/ 100
METRIC RATING
128th/ 347
METRIC RANK
98.4%
1ST GRADE
99.7/ 100
METRIC RATING
58th/ 347
METRIC RANK

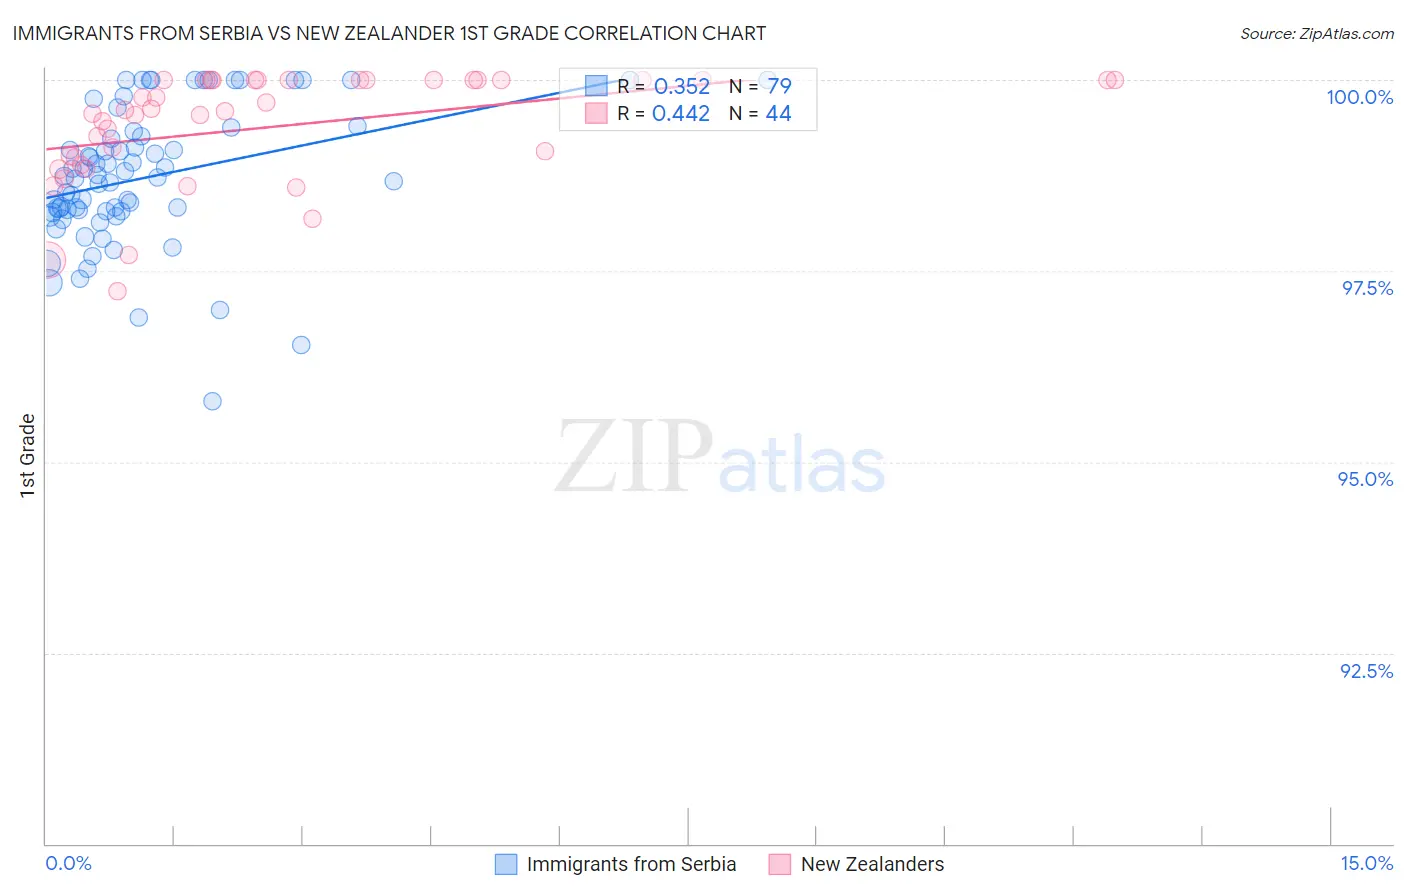
Immigrants from Serbia vs New Zealander 1st Grade Correlation Chart

The statistical analysis conducted on geographies consisting of 131,729,423 people shows a mild positive correlation between the proportion of Immigrants from Serbia and percentage of population with at least 1st grade education in the United States with a correlation coefficient (R) of 0.352 and weighted average of 98.1%. Similarly, the statistical analysis conducted on geographies consisting of 106,905,567 people shows a moderate positive correlation between the proportion of New Zealanders and percentage of population with at least 1st grade education in the United States with a correlation coefficient (R) of 0.442 and weighted average of 98.4%, a difference of 0.27%.
Immigrants from Serbia vs New Zealander 1st Grade

1st Grade Correlation Summary

MeasurementImmigrants from SerbiaNew Zealander
Minimum95.8%97.2%
Maximum100.0%100.0%
Range4.2%2.8%
Mean98.7%99.4%
Median98.7%99.6%
Interquartile 25% (IQ1)98.3%98.9%
Interquartile 75% (IQ3)99.3%100.0%
Interquartile Range (IQR)1.0%1.1%
Standard Deviation (Sample)0.90%0.72%
Standard Deviation (Population)0.89%0.72%

Similar Demographics by 1st Grade

Demographics Similar to Immigrants from Serbia by 1st Grade

In terms of 1st grade, the demographic groups most similar to Immigrants from Serbia are Seminole (98.1%, a difference of 0.0%), Immigrants from Saudi Arabia (98.1%, a difference of 0.010%), Immigrants from Croatia (98.1%, a difference of 0.010%), Spaniard (98.1%, a difference of 0.010%), and Cambodian (98.1%, a difference of 0.010%).
DemographicsRating | Rank1st Grade
Immigrants | Zimbabwe
94.0
/100
|
#121
Exceptional
98.1%
Menominee
93.9
/100
|
#122
Exceptional
98.1%
Iroquois
93.8
/100
|
#123
Exceptional
98.1%
Syrians
93.7
/100
|
#124
Exceptional
98.1%
Immigrants | Japan
93.7
/100
|
#125
Exceptional
98.1%
Lebanese
93.5
/100
|
#126
Exceptional
98.1%
Immigrants | Saudi Arabia
93.3
/100
|
#127
Exceptional
98.1%
Immigrants | Serbia
92.2
/100
|
#128
Exceptional
98.1%
Seminole
91.9
/100
|
#129
Exceptional
98.1%
Immigrants | Croatia
91.4
/100
|
#130
Exceptional
98.1%
Spaniards
91.2
/100
|
#131
Exceptional
98.1%
Cambodians
90.9
/100
|
#132
Exceptional
98.1%
Immigrants | Europe
90.5
/100
|
#133
Exceptional
98.1%
Immigrants | Hungary
89.4
/100
|
#134
Excellent
98.1%
Immigrants | Kuwait
89.3
/100
|
#135
Excellent
98.1%

Demographics Similar to New Zealanders by 1st Grade

In terms of 1st grade, the demographic groups most similar to New Zealanders are Austrian (98.4%, a difference of 0.0%), Creek (98.4%, a difference of 0.0%), Immigrants from Canada (98.4%, a difference of 0.0%), Bulgarian (98.4%, a difference of 0.0%), and Slavic (98.4%, a difference of 0.0%).
DemographicsRating | Rank1st Grade
Estonians
99.8
/100
|
#51
Exceptional
98.4%
Pueblo
99.8
/100
|
#52
Exceptional
98.4%
Kiowa
99.8
/100
|
#53
Exceptional
98.4%
Australians
99.8
/100
|
#54
Exceptional
98.4%
Immigrants | Scotland
99.8
/100
|
#55
Exceptional
98.4%
Americans
99.8
/100
|
#56
Exceptional
98.4%
Austrians
99.8
/100
|
#57
Exceptional
98.4%
New Zealanders
99.7
/100
|
#58
Exceptional
98.4%
Creek
99.7
/100
|
#59
Exceptional
98.4%
Immigrants | Canada
99.7
/100
|
#60
Exceptional
98.4%
Bulgarians
99.7
/100
|
#61
Exceptional
98.4%
Slavs
99.7
/100
|
#62
Exceptional
98.4%
Immigrants | North America
99.7
/100
|
#63
Exceptional
98.4%
Greeks
99.7
/100
|
#64
Exceptional
98.4%
Maltese
99.7
/100
|
#65
Exceptional
98.4%