Immigrants from Senegal vs Immigrants from Colombia Doctorate Degree
COMPARE
Immigrants from Senegal
Immigrants from Colombia
Doctorate Degree
Doctorate Degree Comparison
Immigrants from Senegal
Immigrants from Colombia
1.9%
DOCTORATE DEGREE
82.5/ 100
METRIC RATING
147th/ 347
METRIC RANK
1.7%
DOCTORATE DEGREE
6.7/ 100
METRIC RATING
225th/ 347
METRIC RANK
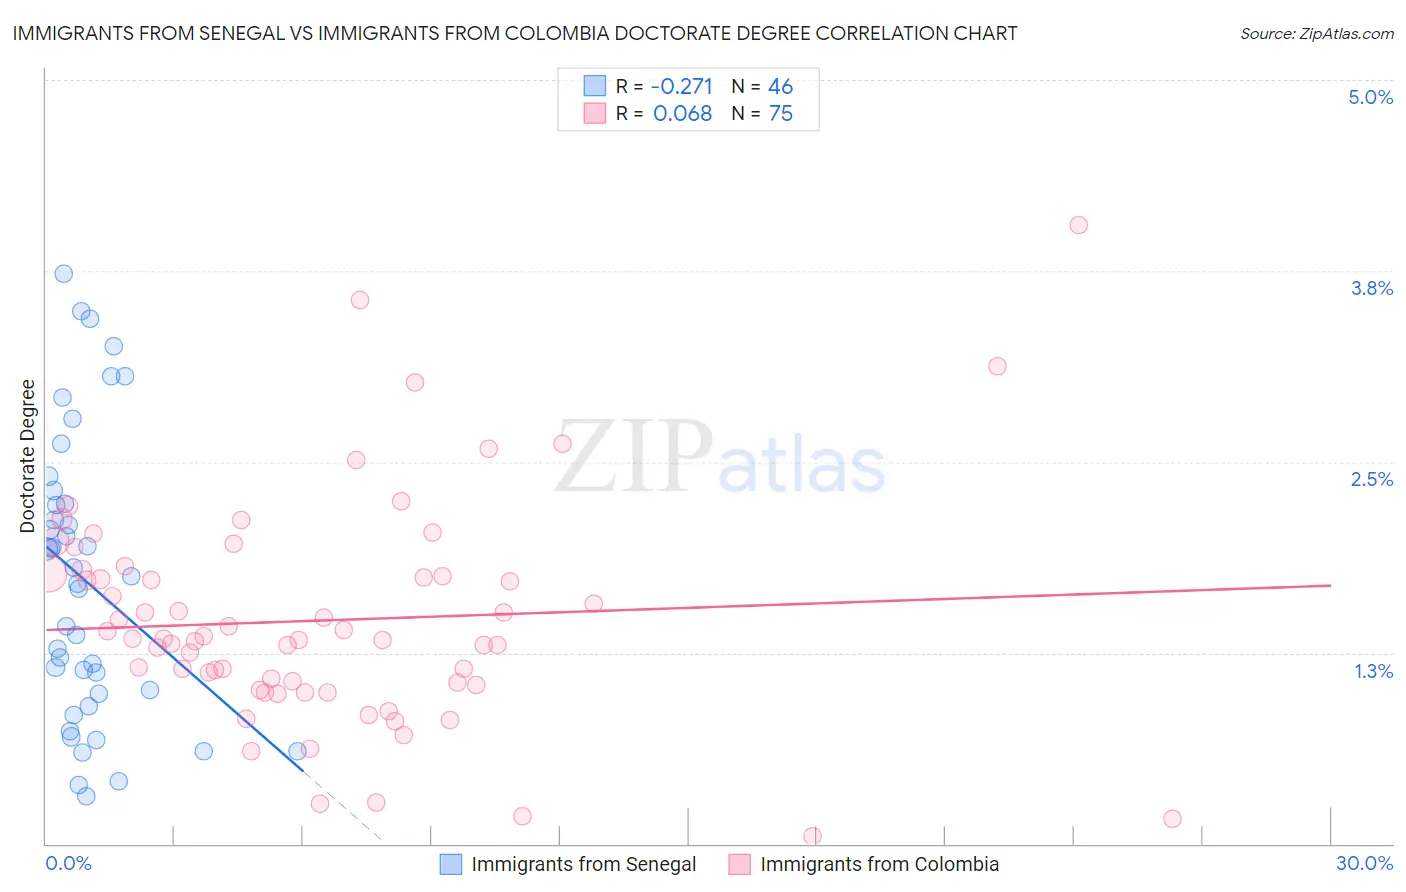
Immigrants from Senegal vs Immigrants from Colombia Doctorate Degree Correlation Chart
The statistical analysis conducted on geographies consisting of 89,977,778 people shows a weak negative correlation between the proportion of Immigrants from Senegal and percentage of population with at least doctorate degree education in the United States with a correlation coefficient (R) of -0.271 and weighted average of 1.9%. Similarly, the statistical analysis conducted on geographies consisting of 375,852,559 people shows a slight positive correlation between the proportion of Immigrants from Colombia and percentage of population with at least doctorate degree education in the United States with a correlation coefficient (R) of 0.068 and weighted average of 1.7%, a difference of 17.0%.
Doctorate Degree Correlation Summary
| Measurement | Immigrants from Senegal | Immigrants from Colombia |
| Minimum | 0.31% | 0.049% |
| Maximum | 3.7% | 4.1% |
| Range | 3.4% | 4.0% |
| Mean | 1.7% | 1.5% |
| Median | 1.7% | 1.3% |
| Interquartile 25% (IQ1) | 0.98% | 1.0% |
| Interquartile 75% (IQ3) | 2.2% | 1.8% |
| Interquartile Range (IQR) | 1.2% | 0.73% |
| Standard Deviation (Sample) | 0.92% | 0.73% |
| Standard Deviation (Population) | 0.91% | 0.72% |
Similar Demographics by Doctorate Degree
Demographics Similar to Immigrants from Senegal by Doctorate Degree
In terms of doctorate degree, the demographic groups most similar to Immigrants from Senegal are Immigrants from Syria (1.9%, a difference of 0.25%), Kenyan (1.9%, a difference of 0.27%), Luxembourger (1.9%, a difference of 0.33%), Immigrants from Moldova (2.0%, a difference of 0.45%), and Sierra Leonean (2.0%, a difference of 0.66%).
| Demographics | Rating | Rank | Doctorate Degree |
| Immigrants | Africa | 87.0 /100 | #140 | Excellent 2.0% |
| Senegalese | 86.7 /100 | #141 | Excellent 2.0% |
| Italians | 86.0 /100 | #142 | Excellent 2.0% |
| Sierra Leoneans | 85.1 /100 | #143 | Excellent 2.0% |
| Immigrants | Moldova | 84.3 /100 | #144 | Excellent 2.0% |
| Kenyans | 83.6 /100 | #145 | Excellent 1.9% |
| Immigrants | Syria | 83.6 /100 | #146 | Excellent 1.9% |
| Immigrants | Senegal | 82.5 /100 | #147 | Excellent 1.9% |
| Luxembourgers | 81.1 /100 | #148 | Excellent 1.9% |
| Basques | 76.9 /100 | #149 | Good 1.9% |
| English | 75.9 /100 | #150 | Good 1.9% |
| Albanians | 74.8 /100 | #151 | Good 1.9% |
| Immigrants | Kenya | 74.3 /100 | #152 | Good 1.9% |
| Immigrants | Oceania | 74.0 /100 | #153 | Good 1.9% |
| Immigrants | Albania | 72.8 /100 | #154 | Good 1.9% |
Demographics Similar to Immigrants from Colombia by Doctorate Degree
In terms of doctorate degree, the demographic groups most similar to Immigrants from Colombia are Osage (1.7%, a difference of 0.12%), Panamanian (1.7%, a difference of 0.26%), Immigrants from Poland (1.7%, a difference of 0.49%), Assyrian/Chaldean/Syriac (1.7%, a difference of 0.53%), and Immigrants from Bosnia and Herzegovina (1.7%, a difference of 0.71%).
| Demographics | Rating | Rank | Doctorate Degree |
| Tlingit-Haida | 11.9 /100 | #218 | Poor 1.7% |
| Immigrants | Iraq | 10.7 /100 | #219 | Poor 1.7% |
| Immigrants | Uruguay | 9.2 /100 | #220 | Tragic 1.7% |
| Immigrants | Nonimmigrants | 8.8 /100 | #221 | Tragic 1.7% |
| Immigrants | Venezuela | 8.7 /100 | #222 | Tragic 1.7% |
| Immigrants | Bosnia and Herzegovina | 7.8 /100 | #223 | Tragic 1.7% |
| Immigrants | Poland | 7.4 /100 | #224 | Tragic 1.7% |
| Immigrants | Colombia | 6.7 /100 | #225 | Tragic 1.7% |
| Osage | 6.5 /100 | #226 | Tragic 1.7% |
| Panamanians | 6.3 /100 | #227 | Tragic 1.7% |
| Assyrians/Chaldeans/Syriacs | 5.9 /100 | #228 | Tragic 1.7% |
| Colville | 4.7 /100 | #229 | Tragic 1.6% |
| Immigrants | Philippines | 4.3 /100 | #230 | Tragic 1.6% |
| Immigrants | North Macedonia | 3.9 /100 | #231 | Tragic 1.6% |
| Guamanians/Chamorros | 3.3 /100 | #232 | Tragic 1.6% |