Immigrants from Senegal vs Hmong 7th Grade

COMPARE

Immigrants from Senegal
Race
Ancestry
AfghanAfricanAlaska NativeAlaskan AthabascanAlbanianAleutAlsatianAmericanApacheArabArapahoArgentineanArmenianAssyrian/Chaldean/SyriacAustralianAustrianBahamianBangladeshiBarbadianBasqueBelgianBelizeanBermudanBhutaneseBlackfeetBolivianBrazilianBritishBritish West IndianBulgarianBurmeseCajunCambodianCanadianCape VerdeanCarpatho RusynCelticCentral AmericanCentral American IndianCherokeeCheyenneChickasawChileanChineseChippewaChoctawColombianColvilleComancheCosta RicanCreeCreekCroatianCrowCubanCypriotCzechCzechoslovakianDanishDelawareDominicanDutchDutch West IndianEastern EuropeanEcuadorianEgyptianEnglishEstonianEthiopianEuropeanFijianFilipinoFinnishFrenchFrench American IndianFrench CanadianGermanGerman RussianGhanaianGreekGuamanian/ChamorroGuatemalanGuyaneseHaitianHonduranHopiHoumaHungarianIcelanderIndian (Asian)IndonesianInupiatIranianIraqiIrishIroquoisIsraeliItalianJamaicanJapaneseJordanianKenyanKiowaKoreanLaotianLatvianLebaneseLiberianLithuanianLumbeeLuxembourgerMacedonianMalaysianMalteseMarshalleseMenomineeMexicanMexican American IndianMongolianMoroccanNative HawaiianNavajoNepaleseNew ZealanderNicaraguanNigerianNorthern EuropeanNorwegianOkinawanOsageOttawaPaiutePakistaniPalestinianPanamanianParaguayanPennsylvania GermanPeruvianPimaPolishPortuguesePotawatomiPuebloPuerto RicanPuget Sound SalishRomanianRussianSalvadoranSamoanScandinavianScotch-IrishScottishSeminoleSenegaleseSerbianShoshoneSierra LeoneanSiouxSlavicSlovakSloveneSomaliSouth AfricanSouth AmericanSouth American IndianSoviet UnionSpaniardSpanishSpanish AmericanSpanish American IndianSri LankanSubsaharan AfricanSudaneseSwedishSwissSyrianTaiwaneseThaiTlingit-HaidaTohono O'OdhamTonganTrinidadian and TobagonianTsimshianTurkishU.S. Virgin IslanderUgandanUkrainianUruguayanUteVenezuelanVietnameseWelshWest IndianYakamaYaquiYugoslavianYumanYup'ikZimbabwean
Immigration
NonimmigrantsImmigrantsAfghanistanAfricaAlbaniaArgentinaArmeniaAsiaAustraliaAustriaBahamasBangladeshBarbadosBelarusBelgiumBelizeBoliviaBosnia and HerzegovinaBrazilBulgariaBurma/MyanmarCabo VerdeCambodiaCameroonCanadaCaribbeanCentral AmericaChileChinaColombiaCongoCosta RicaCroatiaCubaCzechoslovakiaDenmarkDominicaDominican RepublicEastern AfricaEastern AsiaEastern EuropeEcuadorEgyptEl SalvadorEnglandEritreaEthiopiaEuropeFijiFranceGermanyGhanaGreeceGrenadaGuatemalaGuyanaHaitiHondurasHong KongHungaryIndiaIndonesiaIranIraqIrelandIsraelItalyJamaicaJapanJordanKazakhstanKenyaKoreaKuwaitLaosLatin AmericaLatviaLebanonLiberiaLithuaniaMalaysiaMexicoMicronesiaMiddle AfricaMoldovaMoroccoNepalNetherlandsNicaraguaNigeriaNorth AmericaNorth MacedoniaNorthern AfricaNorthern EuropeNorwayOceaniaPakistanPanamaPeruPhilippinesPolandPortugalRomaniaRussiaSaudi ArabiaScotlandSenegalSerbiaSierra LeoneSingaporeSomaliaSouth AfricaSouth AmericaSouth Central AsiaSouth Eastern AsiaSouthern EuropeSpainSri LankaSt. Vincent and the GrenadinesSudanSwedenSwitzerlandSyriaTaiwanThailandTrinidad and TobagoTurkeyUgandaUkraineUruguayUzbekistanVenezuelaVietnamWest IndiesWestern AfricaWestern AsiaWestern EuropeYemenZaireZimbabweAzores
Hmong
Race
Ancestry
AfghanAfricanAlaska NativeAlaskan AthabascanAlbanianAleutAlsatianAmericanApacheArabArapahoArgentineanArmenianAssyrian/Chaldean/SyriacAustralianAustrianBahamianBangladeshiBarbadianBasqueBelgianBelizeanBermudanBhutaneseBlackfeetBolivianBrazilianBritishBritish West IndianBulgarianBurmeseCajunCambodianCanadianCape VerdeanCarpatho RusynCelticCentral AmericanCentral American IndianCherokeeCheyenneChickasawChileanChineseChippewaChoctawColombianColvilleComancheCosta RicanCreeCreekCroatianCrowCubanCypriotCzechCzechoslovakianDanishDelawareDominicanDutchDutch West IndianEastern EuropeanEcuadorianEgyptianEnglishEstonianEthiopianEuropeanFijianFilipinoFinnishFrenchFrench American IndianFrench CanadianGermanGerman RussianGhanaianGreekGuamanian/ChamorroGuatemalanGuyaneseHaitianHmongHonduranHopiHoumaHungarianIcelanderIndian (Asian)IndonesianInupiatIranianIraqiIrishIroquoisIsraeliItalianJamaicanJapaneseJordanianKenyanKiowaKoreanLaotianLatvianLebaneseLiberianLithuanianLumbeeLuxembourgerMacedonianMalaysianMalteseMarshalleseMenomineeMexicanMexican American IndianMongolianMoroccanNative HawaiianNavajoNepaleseNew ZealanderNicaraguanNigerianNorthern EuropeanNorwegianOkinawanOsageOttawaPaiutePakistaniPalestinianPanamanianParaguayanPennsylvania GermanPeruvianPimaPolishPortuguesePotawatomiPuebloPuerto RicanPuget Sound SalishRomanianRussianSalvadoranSamoanScandinavianScotch-IrishScottishSeminoleSenegaleseSerbianShoshoneSierra LeoneanSiouxSlavicSlovakSloveneSomaliSouth AfricanSouth AmericanSouth American IndianSoviet UnionSpaniardSpanishSpanish AmericanSpanish American IndianSri LankanSubsaharan AfricanSudaneseSwedishSwissSyrianTaiwaneseThaiTlingit-HaidaTohono O'OdhamTonganTrinidadian and TobagonianTsimshianTurkishU.S. Virgin IslanderUgandanUkrainianUruguayanUteVenezuelanVietnameseWelshWest IndianYakamaYaquiYugoslavianYumanYup'ikZimbabwean
Immigration
NonimmigrantsImmigrantsAfghanistanAfricaAlbaniaArgentinaArmeniaAsiaAustraliaAustriaBahamasBangladeshBarbadosBelarusBelgiumBelizeBoliviaBosnia and HerzegovinaBrazilBulgariaBurma/MyanmarCabo VerdeCambodiaCameroonCanadaCaribbeanCentral AmericaChileChinaColombiaCongoCosta RicaCroatiaCubaCzechoslovakiaDenmarkDominicaDominican RepublicEastern AfricaEastern AsiaEastern EuropeEcuadorEgyptEl SalvadorEnglandEritreaEthiopiaEuropeFijiFranceGermanyGhanaGreeceGrenadaGuatemalaGuyanaHaitiHondurasHong KongHungaryIndiaIndonesiaIranIraqIrelandIsraelItalyJamaicaJapanJordanKazakhstanKenyaKoreaKuwaitLaosLatin AmericaLatviaLebanonLiberiaLithuaniaMalaysiaMexicoMicronesiaMiddle AfricaMoldovaMoroccoNepalNetherlandsNicaraguaNigeriaNorth AmericaNorth MacedoniaNorthern AfricaNorthern EuropeNorwayOceaniaPakistanPanamaPeruPhilippinesPolandPortugalRomaniaRussiaSaudi ArabiaScotlandSerbiaSierra LeoneSingaporeSomaliaSouth AfricaSouth AmericaSouth Central AsiaSouth Eastern AsiaSouthern EuropeSpainSri LankaSt. Vincent and the GrenadinesSudanSwedenSwitzerlandSyriaTaiwanThailandTrinidad and TobagoTurkeyUgandaUkraineUruguayUzbekistanVenezuelaVietnamWest IndiesWestern AfricaWestern AsiaWestern EuropeYemenZaireZimbabweAzores
7th Grade
Income
Poverty
Unemployment
Labor Participation
Family Structure
Vehicle Availability
Education Level
Disability

7th Grade Comparison

Immigrants from Senegal

Hmong

Tragic
Exceptional
95.5%
7TH GRADE
1.9/ 100
METRIC RATING
242nd/ 347
METRIC RANK
96.4%
7TH GRADE
91.5/ 100
METRIC RATING
133rd/ 347
METRIC RANK

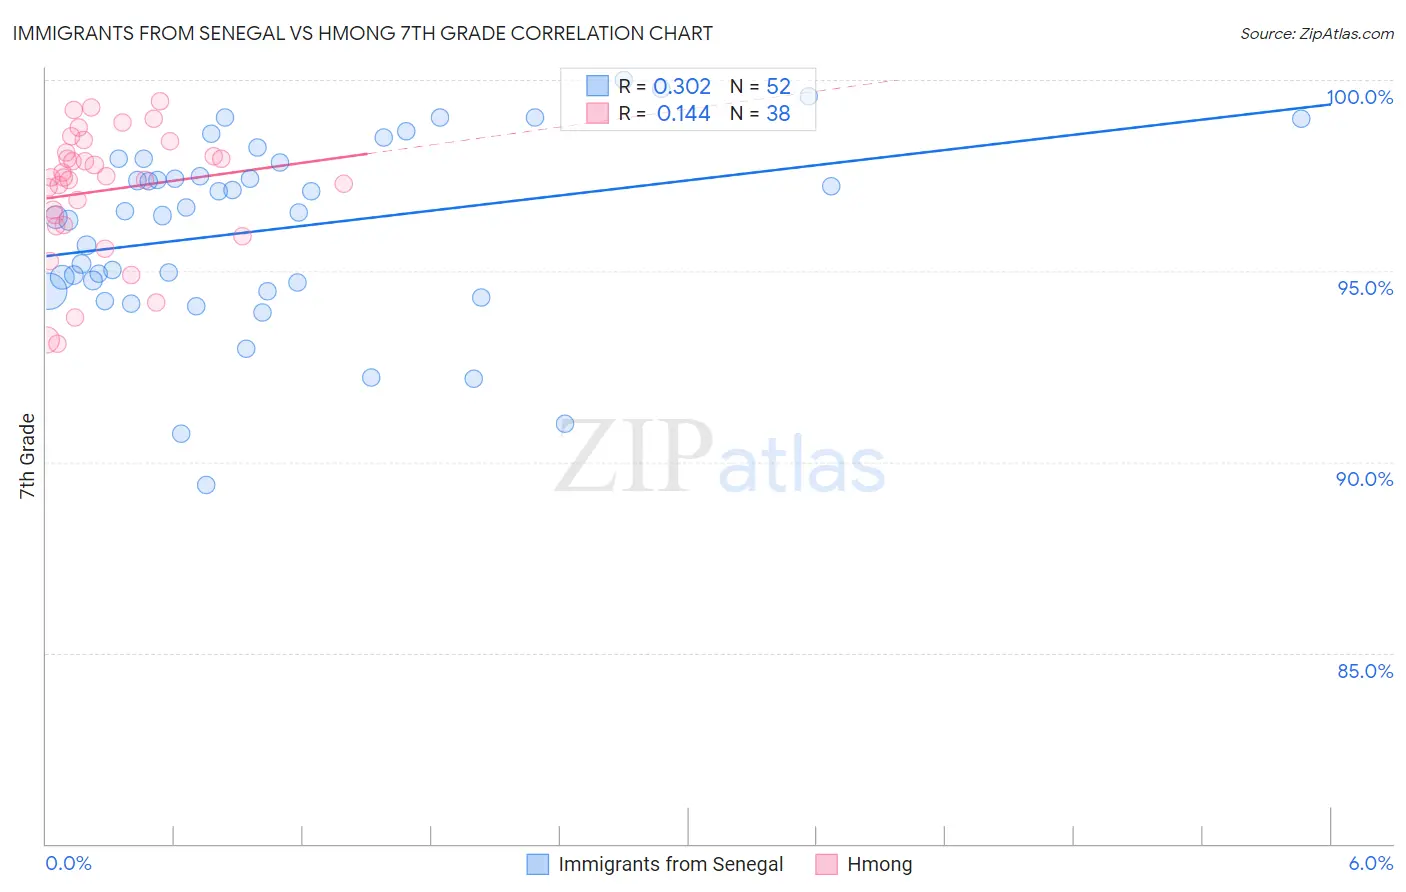
Immigrants from Senegal vs Hmong 7th Grade Correlation Chart

The statistical analysis conducted on geographies consisting of 90,130,297 people shows a mild positive correlation between the proportion of Immigrants from Senegal and percentage of population with at least 7th grade education in the United States with a correlation coefficient (R) of 0.302 and weighted average of 95.5%. Similarly, the statistical analysis conducted on geographies consisting of 24,672,093 people shows a poor positive correlation between the proportion of Hmong and percentage of population with at least 7th grade education in the United States with a correlation coefficient (R) of 0.144 and weighted average of 96.4%, a difference of 0.97%.
Immigrants from Senegal vs Hmong 7th Grade

7th Grade Correlation Summary

MeasurementImmigrants from SenegalHmong
Minimum89.4%93.1%
Maximum100.0%99.5%
Range10.6%6.4%
Mean96.1%97.1%
Median96.6%97.4%
Interquartile 25% (IQ1)94.6%96.2%
Interquartile 75% (IQ3)97.9%98.1%
Interquartile Range (IQR)3.3%1.9%
Standard Deviation (Sample)2.4%1.6%
Standard Deviation (Population)2.4%1.6%

Similar Demographics by 7th Grade

Demographics Similar to Immigrants from Senegal by 7th Grade

In terms of 7th grade, the demographic groups most similar to Immigrants from Senegal are Immigrants from Sierra Leone (95.5%, a difference of 0.0%), South American Indian (95.5%, a difference of 0.0%), Jamaican (95.5%, a difference of 0.020%), U.S. Virgin Islander (95.4%, a difference of 0.020%), and Immigrants from Asia (95.5%, a difference of 0.030%).
DemographicsRating | Rank7th Grade
Immigrants | Africa
2.7
/100
|
#235
Tragic
95.5%
Asians
2.6
/100
|
#236
Tragic
95.5%
Immigrants | Asia
2.3
/100
|
#237
Tragic
95.5%
Indians (Asian)
2.3
/100
|
#238
Tragic
95.5%
Jamaicans
2.2
/100
|
#239
Tragic
95.5%
Immigrants | Sierra Leone
2.0
/100
|
#240
Tragic
95.5%
South American Indians
2.0
/100
|
#241
Tragic
95.5%
Immigrants | Senegal
1.9
/100
|
#242
Tragic
95.5%
U.S. Virgin Islanders
1.6
/100
|
#243
Tragic
95.4%
Uruguayans
1.6
/100
|
#244
Tragic
95.4%
Immigrants | Middle Africa
1.5
/100
|
#245
Tragic
95.4%
Ethiopians
1.5
/100
|
#246
Tragic
95.4%
Tongans
1.3
/100
|
#247
Tragic
95.4%
Paiute
1.2
/100
|
#248
Tragic
95.4%
Bolivians
1.1
/100
|
#249
Tragic
95.4%

Demographics Similar to Hmong by 7th Grade

In terms of 7th grade, the demographic groups most similar to Hmong are Filipino (96.4%, a difference of 0.010%), Colville (96.4%, a difference of 0.010%), Soviet Union (96.4%, a difference of 0.010%), Immigrants from Kuwait (96.4%, a difference of 0.010%), and Immigrants from Hungary (96.4%, a difference of 0.020%).
DemographicsRating | Rank7th Grade
Palestinians
93.5
/100
|
#126
Exceptional
96.4%
Immigrants | Bosnia and Herzegovina
93.3
/100
|
#127
Exceptional
96.4%
Immigrants | Romania
93.2
/100
|
#128
Exceptional
96.4%
Immigrants | North Macedonia
93.1
/100
|
#129
Exceptional
96.4%
Immigrants | Serbia
92.8
/100
|
#130
Exceptional
96.4%
Filipinos
92.1
/100
|
#131
Exceptional
96.4%
Colville
91.7
/100
|
#132
Exceptional
96.4%
Hmong
91.5
/100
|
#133
Exceptional
96.4%
Soviet Union
91.2
/100
|
#134
Exceptional
96.4%
Immigrants | Kuwait
91.1
/100
|
#135
Exceptional
96.4%
Immigrants | Hungary
90.6
/100
|
#136
Exceptional
96.4%
Immigrants | Turkey
90.2
/100
|
#137
Exceptional
96.4%
Jordanians
90.0
/100
|
#138
Excellent
96.4%
Basques
89.3
/100
|
#139
Excellent
96.4%
Cambodians
88.3
/100
|
#140
Excellent
96.3%