Immigrants from Scotland vs Guamanian/Chamorro 11th Grade

COMPARE

Immigrants from Scotland
Race
Ancestry
AfghanAfricanAlaska NativeAlaskan AthabascanAlbanianAleutAlsatianAmericanApacheArabArapahoArgentineanArmenianAssyrian/Chaldean/SyriacAustralianAustrianBahamianBangladeshiBarbadianBasqueBelgianBelizeanBermudanBhutaneseBlackfeetBolivianBrazilianBritishBritish West IndianBulgarianBurmeseCajunCambodianCanadianCape VerdeanCarpatho RusynCelticCentral AmericanCentral American IndianCherokeeCheyenneChickasawChileanChineseChippewaChoctawColombianColvilleComancheCosta RicanCreeCreekCroatianCrowCubanCypriotCzechCzechoslovakianDanishDelawareDominicanDutchDutch West IndianEastern EuropeanEcuadorianEgyptianEnglishEstonianEthiopianEuropeanFijianFilipinoFinnishFrenchFrench American IndianFrench CanadianGermanGerman RussianGhanaianGreekGuatemalanGuyaneseHaitianHmongHonduranHopiHoumaHungarianIcelanderIndian (Asian)IndonesianInupiatIranianIraqiIrishIroquoisIsraeliItalianJamaicanJapaneseJordanianKenyanKiowaKoreanLaotianLatvianLebaneseLiberianLithuanianLumbeeLuxembourgerMacedonianMalaysianMalteseMarshalleseMenomineeMexicanMexican American IndianMongolianMoroccanNative HawaiianNavajoNepaleseNew ZealanderNicaraguanNigerianNorthern EuropeanNorwegianOkinawanOsageOttawaPaiutePakistaniPalestinianPanamanianParaguayanPennsylvania GermanPeruvianPimaPolishPortuguesePotawatomiPuebloPuerto RicanPuget Sound SalishRomanianRussianSalvadoranSamoanScandinavianScotch-IrishScottishSeminoleSenegaleseSerbianShoshoneSierra LeoneanSiouxSlavicSlovakSloveneSomaliSouth AfricanSouth AmericanSouth American IndianSoviet UnionSpaniardSpanishSpanish AmericanSpanish American IndianSri LankanSubsaharan AfricanSudaneseSwedishSwissSyrianTaiwaneseThaiTlingit-HaidaTohono O'OdhamTonganTrinidadian and TobagonianTsimshianTurkishU.S. Virgin IslanderUgandanUkrainianUruguayanUteVenezuelanVietnameseWelshWest IndianYakamaYaquiYugoslavianYumanYup'ikZimbabwean
Immigration
NonimmigrantsImmigrantsAfghanistanAfricaAlbaniaArgentinaArmeniaAsiaAustraliaAustriaBahamasBangladeshBarbadosBelarusBelgiumBelizeBoliviaBosnia and HerzegovinaBrazilBulgariaBurma/MyanmarCabo VerdeCambodiaCameroonCanadaCaribbeanCentral AmericaChileChinaColombiaCongoCosta RicaCroatiaCubaCzechoslovakiaDenmarkDominicaDominican RepublicEastern AfricaEastern AsiaEastern EuropeEcuadorEgyptEl SalvadorEnglandEritreaEthiopiaEuropeFijiFranceGermanyGhanaGreeceGrenadaGuatemalaGuyanaHaitiHondurasHong KongHungaryIndiaIndonesiaIranIraqIrelandIsraelItalyJamaicaJapanJordanKazakhstanKenyaKoreaKuwaitLaosLatin AmericaLatviaLebanonLiberiaLithuaniaMalaysiaMexicoMicronesiaMiddle AfricaMoldovaMoroccoNepalNetherlandsNicaraguaNigeriaNorth AmericaNorth MacedoniaNorthern AfricaNorthern EuropeNorwayOceaniaPakistanPanamaPeruPhilippinesPolandPortugalRomaniaRussiaSaudi ArabiaScotlandSenegalSerbiaSierra LeoneSingaporeSomaliaSouth AfricaSouth AmericaSouth Central AsiaSouth Eastern AsiaSouthern EuropeSpainSri LankaSt. Vincent and the GrenadinesSudanSwedenSwitzerlandSyriaTaiwanThailandTrinidad and TobagoTurkeyUgandaUkraineUruguayUzbekistanVenezuelaVietnamWest IndiesWestern AfricaWestern AsiaWestern EuropeYemenZaireZimbabweAzores
Guamanian/Chamorro
Race
Ancestry
AfghanAfricanAlaska NativeAlaskan AthabascanAlbanianAleutAlsatianAmericanApacheArabArapahoArgentineanArmenianAssyrian/Chaldean/SyriacAustralianAustrianBahamianBangladeshiBarbadianBasqueBelgianBelizeanBermudanBhutaneseBlackfeetBolivianBrazilianBritishBritish West IndianBulgarianBurmeseCajunCambodianCanadianCape VerdeanCarpatho RusynCelticCentral AmericanCentral American IndianCherokeeCheyenneChickasawChileanChineseChippewaChoctawColombianColvilleComancheCosta RicanCreeCreekCroatianCrowCubanCypriotCzechCzechoslovakianDanishDelawareDominicanDutchDutch West IndianEastern EuropeanEcuadorianEgyptianEnglishEstonianEthiopianEuropeanFijianFilipinoFinnishFrenchFrench American IndianFrench CanadianGermanGerman RussianGhanaianGreekGuamanian/ChamorroGuatemalanGuyaneseHaitianHmongHonduranHopiHoumaHungarianIcelanderIndian (Asian)IndonesianInupiatIranianIraqiIrishIroquoisIsraeliItalianJamaicanJapaneseJordanianKenyanKiowaKoreanLaotianLatvianLebaneseLiberianLithuanianLumbeeLuxembourgerMacedonianMalaysianMalteseMarshalleseMenomineeMexicanMexican American IndianMongolianMoroccanNative HawaiianNavajoNepaleseNew ZealanderNicaraguanNigerianNorthern EuropeanNorwegianOkinawanOsageOttawaPaiutePakistaniPalestinianPanamanianParaguayanPennsylvania GermanPeruvianPimaPolishPortuguesePotawatomiPuebloPuerto RicanPuget Sound SalishRomanianRussianSalvadoranSamoanScandinavianScotch-IrishScottishSeminoleSenegaleseSerbianShoshoneSierra LeoneanSiouxSlavicSlovakSloveneSomaliSouth AfricanSouth AmericanSouth American IndianSoviet UnionSpaniardSpanishSpanish AmericanSpanish American IndianSri LankanSubsaharan AfricanSudaneseSwedishSwissSyrianTaiwaneseThaiTlingit-HaidaTohono O'OdhamTonganTrinidadian and TobagonianTsimshianTurkishU.S. Virgin IslanderUgandanUkrainianUruguayanUteVenezuelanVietnameseWelshWest IndianYakamaYaquiYugoslavianYumanYup'ikZimbabwean
Immigration
NonimmigrantsImmigrantsAfghanistanAfricaAlbaniaArgentinaArmeniaAsiaAustraliaAustriaBahamasBangladeshBarbadosBelarusBelgiumBelizeBoliviaBosnia and HerzegovinaBrazilBulgariaBurma/MyanmarCabo VerdeCambodiaCameroonCanadaCaribbeanCentral AmericaChileChinaColombiaCongoCosta RicaCroatiaCubaCzechoslovakiaDenmarkDominicaDominican RepublicEastern AfricaEastern AsiaEastern EuropeEcuadorEgyptEl SalvadorEnglandEritreaEthiopiaEuropeFijiFranceGermanyGhanaGreeceGrenadaGuatemalaGuyanaHaitiHondurasHong KongHungaryIndiaIndonesiaIranIraqIrelandIsraelItalyJamaicaJapanJordanKazakhstanKenyaKoreaKuwaitLaosLatin AmericaLatviaLebanonLiberiaLithuaniaMalaysiaMexicoMicronesiaMiddle AfricaMoldovaMoroccoNepalNetherlandsNicaraguaNigeriaNorth AmericaNorth MacedoniaNorthern AfricaNorthern EuropeNorwayOceaniaPakistanPanamaPeruPhilippinesPolandPortugalRomaniaRussiaSaudi ArabiaSenegalSerbiaSierra LeoneSingaporeSomaliaSouth AfricaSouth AmericaSouth Central AsiaSouth Eastern AsiaSouthern EuropeSpainSri LankaSt. Vincent and the GrenadinesSudanSwedenSwitzerlandSyriaTaiwanThailandTrinidad and TobagoTurkeyUgandaUkraineUruguayUzbekistanVenezuelaVietnamWest IndiesWestern AfricaWestern AsiaWestern EuropeYemenZaireZimbabweAzores
11th Grade
Income
Poverty
Unemployment
Labor Participation
Family Structure
Vehicle Availability
Education Level
Disability

11th Grade Comparison

Immigrants from Scotland

Guamanians/Chamorros

Exceptional
Average
94.2%
11TH GRADE
99.9/ 100
METRIC RATING
34th/ 347
METRIC RANK
92.5%
11TH GRADE
45.0/ 100
METRIC RATING
177th/ 347
METRIC RANK

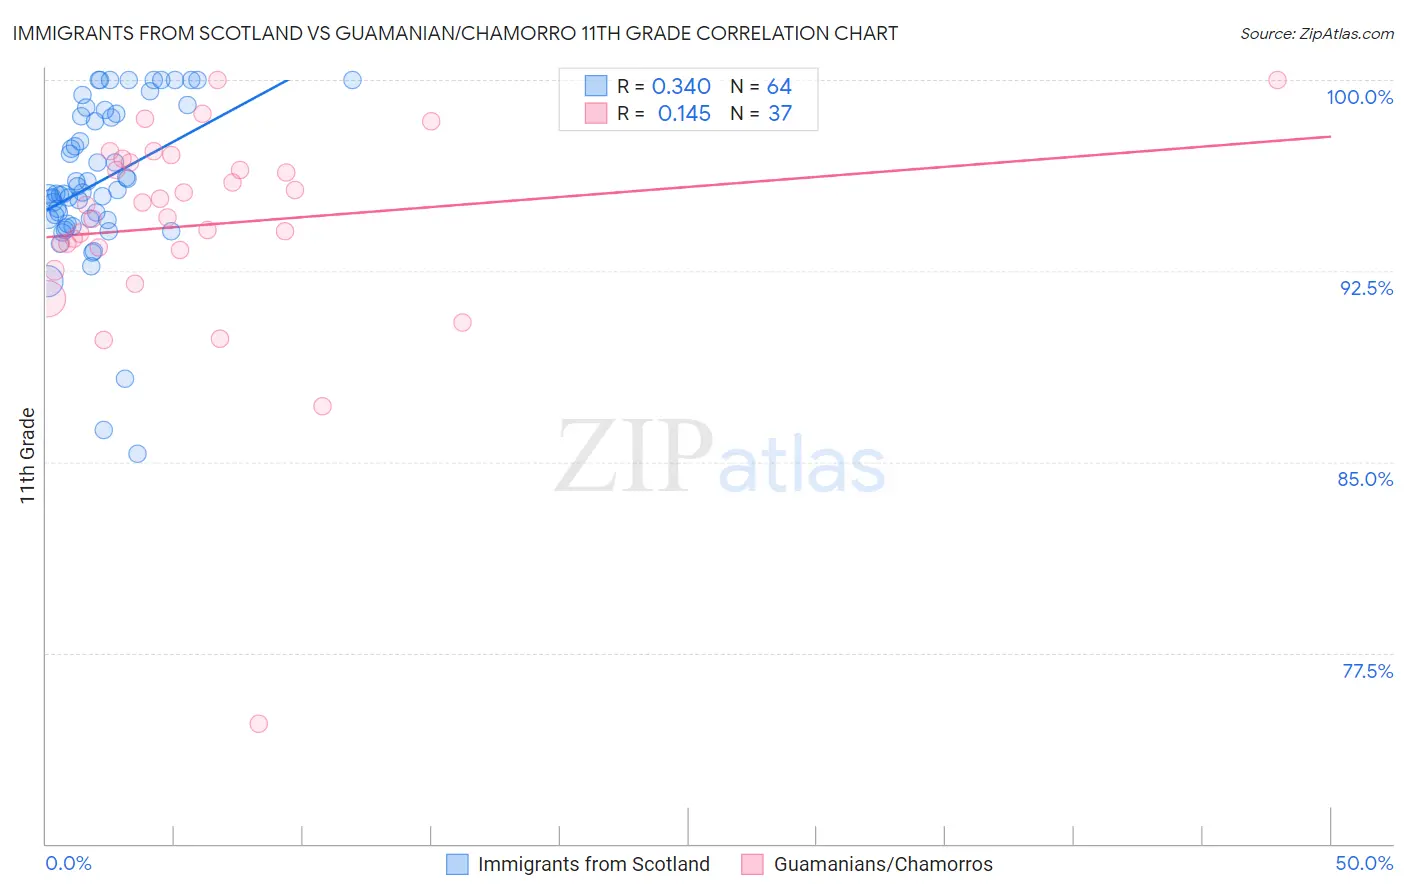
Immigrants from Scotland vs Guamanian/Chamorro 11th Grade Correlation Chart

The statistical analysis conducted on geographies consisting of 196,398,887 people shows a mild positive correlation between the proportion of Immigrants from Scotland and percentage of population with at least 11th grade education in the United States with a correlation coefficient (R) of 0.340 and weighted average of 94.2%. Similarly, the statistical analysis conducted on geographies consisting of 221,965,618 people shows a poor positive correlation between the proportion of Guamanians/Chamorros and percentage of population with at least 11th grade education in the United States with a correlation coefficient (R) of 0.145 and weighted average of 92.5%, a difference of 1.9%.
Immigrants from Scotland vs Guamanian/Chamorro 11th Grade

11th Grade Correlation Summary

MeasurementImmigrants from ScotlandGuamanian/Chamorro
Minimum85.3%74.7%
Maximum100.0%100.0%
Range14.7%25.3%
Mean96.0%94.3%
Median95.6%95.1%
Interquartile 25% (IQ1)94.5%93.4%
Interquartile 75% (IQ3)98.6%96.8%
Interquartile Range (IQR)4.1%3.5%
Standard Deviation (Sample)3.1%4.4%
Standard Deviation (Population)3.1%4.3%

Similar Demographics by 11th Grade

Demographics Similar to Immigrants from Scotland by 11th Grade

In terms of 11th grade, the demographic groups most similar to Immigrants from Scotland are British (94.2%, a difference of 0.0%), Immigrants from Singapore (94.2%, a difference of 0.010%), Immigrants from Northern Europe (94.2%, a difference of 0.010%), Northern European (94.2%, a difference of 0.020%), and Hungarian (94.2%, a difference of 0.020%).
DemographicsRating | Rank11th Grade
Europeans
100.0
/100
|
#27
Exceptional
94.4%
Estonians
100.0
/100
|
#28
Exceptional
94.4%
Dutch
100.0
/100
|
#29
Exceptional
94.3%
Russians
100.0
/100
|
#30
Exceptional
94.3%
Welsh
99.9
/100
|
#31
Exceptional
94.2%
Belgians
99.9
/100
|
#32
Exceptional
94.2%
British
99.9
/100
|
#33
Exceptional
94.2%
Immigrants | Scotland
99.9
/100
|
#34
Exceptional
94.2%
Immigrants | Singapore
99.9
/100
|
#35
Exceptional
94.2%
Immigrants | Northern Europe
99.9
/100
|
#36
Exceptional
94.2%
Northern Europeans
99.9
/100
|
#37
Exceptional
94.2%
Hungarians
99.9
/100
|
#38
Exceptional
94.2%
Immigrants | Lithuania
99.9
/100
|
#39
Exceptional
94.1%
Thais
99.9
/100
|
#40
Exceptional
94.1%
Cypriots
99.9
/100
|
#41
Exceptional
94.1%

Demographics Similar to Guamanians/Chamorros by 11th Grade

In terms of 11th grade, the demographic groups most similar to Guamanians/Chamorros are Spaniard (92.5%, a difference of 0.020%), Sudanese (92.5%, a difference of 0.020%), Shoshone (92.5%, a difference of 0.040%), Creek (92.4%, a difference of 0.040%), and Inupiat (92.4%, a difference of 0.040%).
DemographicsRating | Rank11th Grade
Immigrants | Northern Africa
57.3
/100
|
#170
Average
92.6%
Laotians
54.4
/100
|
#171
Average
92.6%
Immigrants | Pakistan
52.3
/100
|
#172
Average
92.5%
Indians (Asian)
51.5
/100
|
#173
Average
92.5%
Asians
50.0
/100
|
#174
Average
92.5%
Shoshone
48.9
/100
|
#175
Average
92.5%
Spaniards
46.9
/100
|
#176
Average
92.5%
Guamanians/Chamorros
45.0
/100
|
#177
Average
92.5%
Sudanese
43.4
/100
|
#178
Average
92.5%
Creek
40.9
/100
|
#179
Average
92.4%
Inupiat
40.7
/100
|
#180
Average
92.4%
Cherokee
40.7
/100
|
#181
Average
92.4%
Immigrants | Morocco
38.6
/100
|
#182
Fair
92.4%
Immigrants | Malaysia
37.6
/100
|
#183
Fair
92.4%
Immigrants | Asia
37.4
/100
|
#184
Fair
92.4%