Immigrants from Saudi Arabia vs Immigrants from Nepal 7th Grade
COMPARE
Immigrants from Saudi Arabia
Immigrants from Nepal
7th Grade
7th Grade Comparison
Immigrants from Saudi Arabia
Immigrants from Nepal
96.6%
7TH GRADE
97.8/ 100
METRIC RATING
108th/ 347
METRIC RANK
95.9%
7TH GRADE
30.0/ 100
METRIC RATING
194th/ 347
METRIC RANK
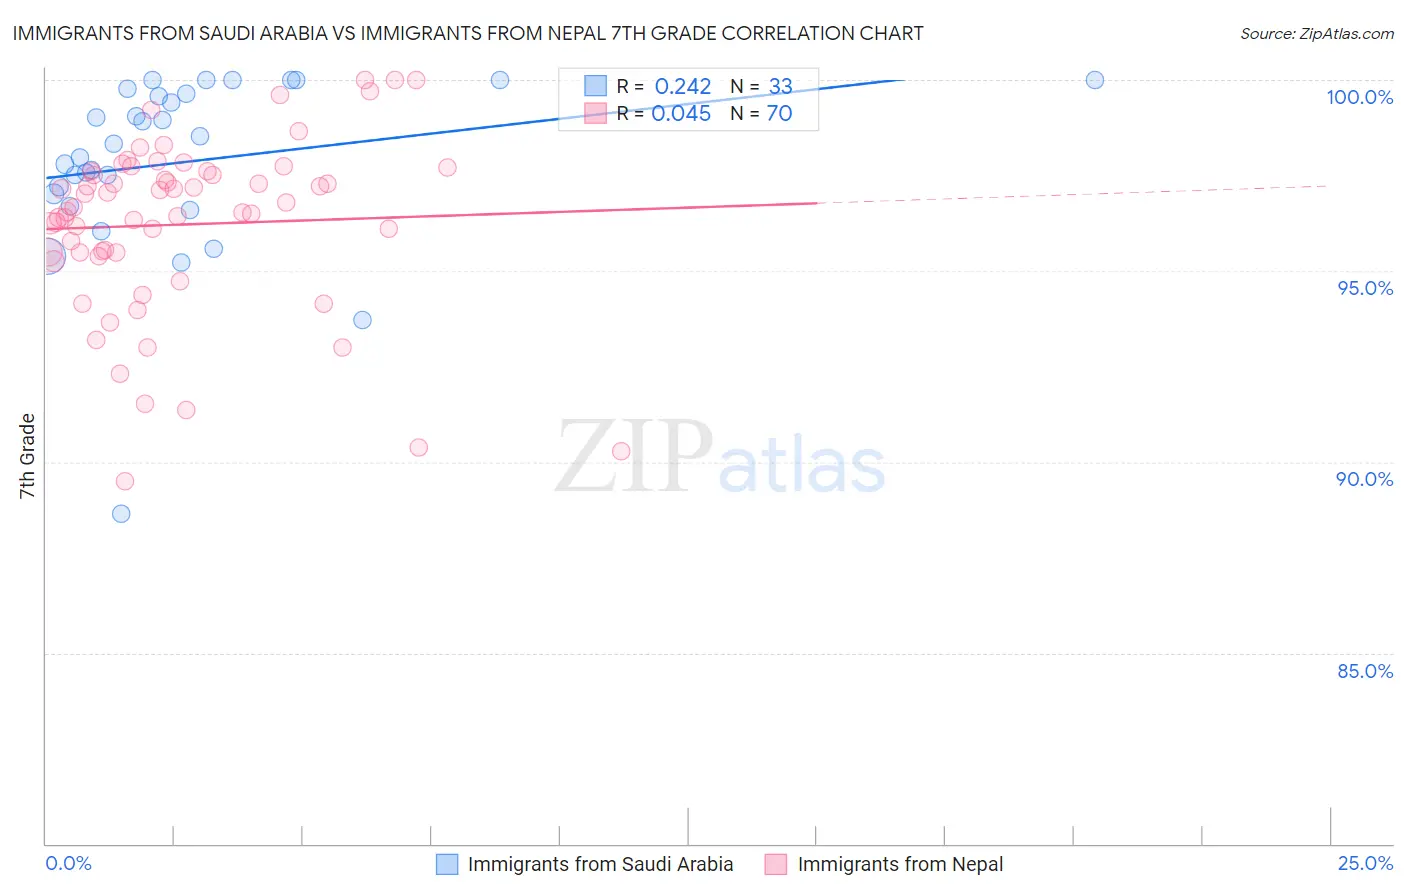
Immigrants from Saudi Arabia vs Immigrants from Nepal 7th Grade Correlation Chart
The statistical analysis conducted on geographies consisting of 164,277,573 people shows a weak positive correlation between the proportion of Immigrants from Saudi Arabia and percentage of population with at least 7th grade education in the United States with a correlation coefficient (R) of 0.242 and weighted average of 96.6%. Similarly, the statistical analysis conducted on geographies consisting of 186,622,433 people shows no correlation between the proportion of Immigrants from Nepal and percentage of population with at least 7th grade education in the United States with a correlation coefficient (R) of 0.045 and weighted average of 95.9%, a difference of 0.71%.
7th Grade Correlation Summary
| Measurement | Immigrants from Saudi Arabia | Immigrants from Nepal |
| Minimum | 88.6% | 89.5% |
| Maximum | 100.0% | 100.0% |
| Range | 11.4% | 10.5% |
| Mean | 97.9% | 96.2% |
| Median | 98.3% | 96.6% |
| Interquartile 25% (IQ1) | 96.9% | 95.5% |
| Interquartile 75% (IQ3) | 99.7% | 97.6% |
| Interquartile Range (IQR) | 2.9% | 2.1% |
| Standard Deviation (Sample) | 2.4% | 2.3% |
| Standard Deviation (Population) | 2.3% | 2.3% |
Similar Demographics by 7th Grade
Demographics Similar to Immigrants from Saudi Arabia by 7th Grade
In terms of 7th grade, the demographic groups most similar to Immigrants from Saudi Arabia are Lumbee (96.6%, a difference of 0.0%), Iroquois (96.6%, a difference of 0.010%), Bhutanese (96.6%, a difference of 0.010%), South African (96.6%, a difference of 0.020%), and Okinawan (96.6%, a difference of 0.020%).
| Demographics | Rating | Rank | 7th Grade |
| Thais | 98.6 /100 | #101 | Exceptional 96.7% |
| Immigrants | Czechoslovakia | 98.3 /100 | #102 | Exceptional 96.6% |
| Immigrants | Singapore | 98.3 /100 | #103 | Exceptional 96.6% |
| Shoshone | 98.1 /100 | #104 | Exceptional 96.6% |
| South Africans | 98.0 /100 | #105 | Exceptional 96.6% |
| Iroquois | 97.9 /100 | #106 | Exceptional 96.6% |
| Lumbee | 97.8 /100 | #107 | Exceptional 96.6% |
| Immigrants | Saudi Arabia | 97.8 /100 | #108 | Exceptional 96.6% |
| Bhutanese | 97.7 /100 | #109 | Exceptional 96.6% |
| Okinawans | 97.4 /100 | #110 | Exceptional 96.6% |
| Immigrants | Latvia | 97.4 /100 | #111 | Exceptional 96.6% |
| Immigrants | Nonimmigrants | 97.0 /100 | #112 | Exceptional 96.5% |
| Pueblo | 96.8 /100 | #113 | Exceptional 96.5% |
| Immigrants | Zimbabwe | 96.6 /100 | #114 | Exceptional 96.5% |
| Choctaw | 96.6 /100 | #115 | Exceptional 96.5% |
Demographics Similar to Immigrants from Nepal by 7th Grade
In terms of 7th grade, the demographic groups most similar to Immigrants from Nepal are Immigrants from Bahamas (95.9%, a difference of 0.010%), Sudanese (95.9%, a difference of 0.010%), Immigrants from Micronesia (95.9%, a difference of 0.020%), Liberian (95.9%, a difference of 0.020%), and Panamanian (95.9%, a difference of 0.020%).
| Demographics | Rating | Rank | 7th Grade |
| Immigrants | Uganda | 36.0 /100 | #187 | Fair 96.0% |
| Immigrants | Egypt | 34.3 /100 | #188 | Fair 95.9% |
| Immigrants | Venezuela | 33.9 /100 | #189 | Fair 95.9% |
| Immigrants | Micronesia | 32.6 /100 | #190 | Fair 95.9% |
| Liberians | 32.5 /100 | #191 | Fair 95.9% |
| Panamanians | 32.3 /100 | #192 | Fair 95.9% |
| Immigrants | Bahamas | 30.8 /100 | #193 | Fair 95.9% |
| Immigrants | Nepal | 30.0 /100 | #194 | Fair 95.9% |
| Sudanese | 28.1 /100 | #195 | Fair 95.9% |
| Apache | 27.6 /100 | #196 | Fair 95.9% |
| Immigrants | Zaire | 26.7 /100 | #197 | Fair 95.9% |
| Paraguayans | 24.8 /100 | #198 | Fair 95.9% |
| Guamanians/Chamorros | 23.5 /100 | #199 | Fair 95.9% |
| Argentineans | 23.2 /100 | #200 | Fair 95.9% |
| Immigrants | Argentina | 21.9 /100 | #201 | Fair 95.9% |