Immigrants from Russia vs Yaqui 3rd Grade

COMPARE

Immigrants from Russia
Race
Ancestry
AfghanAfricanAlaska NativeAlaskan AthabascanAlbanianAleutAlsatianAmericanApacheArabArapahoArgentineanArmenianAssyrian/Chaldean/SyriacAustralianAustrianBahamianBangladeshiBarbadianBasqueBelgianBelizeanBermudanBhutaneseBlackfeetBolivianBrazilianBritishBritish West IndianBulgarianBurmeseCajunCambodianCanadianCape VerdeanCarpatho RusynCelticCentral AmericanCentral American IndianCherokeeCheyenneChickasawChileanChineseChippewaChoctawColombianColvilleComancheCosta RicanCreeCreekCroatianCrowCubanCypriotCzechCzechoslovakianDanishDelawareDominicanDutchDutch West IndianEastern EuropeanEcuadorianEgyptianEnglishEstonianEthiopianEuropeanFijianFilipinoFinnishFrenchFrench American IndianFrench CanadianGermanGerman RussianGhanaianGreekGuamanian/ChamorroGuatemalanGuyaneseHaitianHmongHonduranHopiHoumaHungarianIcelanderIndian (Asian)IndonesianInupiatIranianIraqiIrishIroquoisIsraeliItalianJamaicanJapaneseJordanianKenyanKiowaKoreanLaotianLatvianLebaneseLiberianLithuanianLumbeeLuxembourgerMacedonianMalaysianMalteseMarshalleseMenomineeMexicanMexican American IndianMongolianMoroccanNative HawaiianNavajoNepaleseNew ZealanderNicaraguanNigerianNorthern EuropeanNorwegianOkinawanOsageOttawaPaiutePakistaniPalestinianPanamanianParaguayanPennsylvania GermanPeruvianPimaPolishPortuguesePotawatomiPuebloPuerto RicanPuget Sound SalishRomanianRussianSalvadoranSamoanScandinavianScotch-IrishScottishSeminoleSenegaleseSerbianShoshoneSierra LeoneanSiouxSlavicSlovakSloveneSomaliSouth AfricanSouth AmericanSouth American IndianSoviet UnionSpaniardSpanishSpanish AmericanSpanish American IndianSri LankanSubsaharan AfricanSudaneseSwedishSwissSyrianTaiwaneseThaiTlingit-HaidaTohono O'OdhamTonganTrinidadian and TobagonianTsimshianTurkishU.S. Virgin IslanderUgandanUkrainianUruguayanUteVenezuelanVietnameseWelshWest IndianYakamaYugoslavianYumanYup'ikZimbabwean
Immigration
NonimmigrantsImmigrantsAfghanistanAfricaAlbaniaArgentinaArmeniaAsiaAustraliaAustriaBahamasBangladeshBarbadosBelarusBelgiumBelizeBoliviaBosnia and HerzegovinaBrazilBulgariaBurma/MyanmarCabo VerdeCambodiaCameroonCanadaCaribbeanCentral AmericaChileChinaColombiaCongoCosta RicaCroatiaCubaCzechoslovakiaDenmarkDominicaDominican RepublicEastern AfricaEastern AsiaEastern EuropeEcuadorEgyptEl SalvadorEnglandEritreaEthiopiaEuropeFijiFranceGermanyGhanaGreeceGrenadaGuatemalaGuyanaHaitiHondurasHong KongHungaryIndiaIndonesiaIranIraqIrelandIsraelItalyJamaicaJapanJordanKazakhstanKenyaKoreaKuwaitLaosLatin AmericaLatviaLebanonLiberiaLithuaniaMalaysiaMexicoMicronesiaMiddle AfricaMoldovaMoroccoNepalNetherlandsNicaraguaNigeriaNorth AmericaNorth MacedoniaNorthern AfricaNorthern EuropeNorwayOceaniaPakistanPanamaPeruPhilippinesPolandPortugalRomaniaRussiaSaudi ArabiaScotlandSenegalSerbiaSierra LeoneSingaporeSomaliaSouth AfricaSouth AmericaSouth Central AsiaSouth Eastern AsiaSouthern EuropeSpainSri LankaSt. Vincent and the GrenadinesSudanSwedenSwitzerlandSyriaTaiwanThailandTrinidad and TobagoTurkeyUgandaUkraineUruguayUzbekistanVenezuelaVietnamWest IndiesWestern AfricaWestern AsiaWestern EuropeYemenZaireZimbabweAzores
Yaqui
Race
Ancestry
AfghanAfricanAlaska NativeAlaskan AthabascanAlbanianAleutAlsatianAmericanApacheArabArapahoArgentineanArmenianAssyrian/Chaldean/SyriacAustralianAustrianBahamianBangladeshiBarbadianBasqueBelgianBelizeanBermudanBhutaneseBlackfeetBolivianBrazilianBritishBritish West IndianBulgarianBurmeseCajunCambodianCanadianCape VerdeanCarpatho RusynCelticCentral AmericanCentral American IndianCherokeeCheyenneChickasawChileanChineseChippewaChoctawColombianColvilleComancheCosta RicanCreeCreekCroatianCrowCubanCypriotCzechCzechoslovakianDanishDelawareDominicanDutchDutch West IndianEastern EuropeanEcuadorianEgyptianEnglishEstonianEthiopianEuropeanFijianFilipinoFinnishFrenchFrench American IndianFrench CanadianGermanGerman RussianGhanaianGreekGuamanian/ChamorroGuatemalanGuyaneseHaitianHmongHonduranHopiHoumaHungarianIcelanderIndian (Asian)IndonesianInupiatIranianIraqiIrishIroquoisIsraeliItalianJamaicanJapaneseJordanianKenyanKiowaKoreanLaotianLatvianLebaneseLiberianLithuanianLumbeeLuxembourgerMacedonianMalaysianMalteseMarshalleseMenomineeMexicanMexican American IndianMongolianMoroccanNative HawaiianNavajoNepaleseNew ZealanderNicaraguanNigerianNorthern EuropeanNorwegianOkinawanOsageOttawaPaiutePakistaniPalestinianPanamanianParaguayanPennsylvania GermanPeruvianPimaPolishPortuguesePotawatomiPuebloPuerto RicanPuget Sound SalishRomanianRussianSalvadoranSamoanScandinavianScotch-IrishScottishSeminoleSenegaleseSerbianShoshoneSierra LeoneanSiouxSlavicSlovakSloveneSomaliSouth AfricanSouth AmericanSouth American IndianSoviet UnionSpaniardSpanishSpanish AmericanSpanish American IndianSri LankanSubsaharan AfricanSudaneseSwedishSwissSyrianTaiwaneseThaiTlingit-HaidaTohono O'OdhamTonganTrinidadian and TobagonianTsimshianTurkishU.S. Virgin IslanderUgandanUkrainianUruguayanUteVenezuelanVietnameseWelshWest IndianYakamaYaquiYugoslavianYumanYup'ikZimbabwean
Immigration
NonimmigrantsImmigrantsAfghanistanAfricaAlbaniaArgentinaArmeniaAsiaAustraliaAustriaBahamasBangladeshBarbadosBelarusBelgiumBelizeBoliviaBosnia and HerzegovinaBrazilBulgariaBurma/MyanmarCabo VerdeCambodiaCameroonCanadaCaribbeanCentral AmericaChileChinaColombiaCongoCosta RicaCroatiaCubaCzechoslovakiaDenmarkDominicaDominican RepublicEastern AfricaEastern AsiaEastern EuropeEcuadorEgyptEl SalvadorEnglandEritreaEthiopiaEuropeFijiFranceGermanyGhanaGreeceGrenadaGuatemalaGuyanaHaitiHondurasHong KongHungaryIndiaIndonesiaIranIraqIrelandIsraelItalyJamaicaJapanJordanKazakhstanKenyaKoreaKuwaitLaosLatin AmericaLatviaLebanonLiberiaLithuaniaMalaysiaMexicoMicronesiaMiddle AfricaMoldovaMoroccoNepalNetherlandsNicaraguaNigeriaNorth AmericaNorth MacedoniaNorthern AfricaNorthern EuropeNorwayOceaniaPakistanPanamaPeruPhilippinesPolandPortugalRomaniaSaudi ArabiaScotlandSenegalSerbiaSierra LeoneSingaporeSomaliaSouth AfricaSouth AmericaSouth Central AsiaSouth Eastern AsiaSouthern EuropeSpainSri LankaSt. Vincent and the GrenadinesSudanSwedenSwitzerlandSyriaTaiwanThailandTrinidad and TobagoTurkeyUgandaUkraineUruguayUzbekistanVenezuelaVietnamWest IndiesWestern AfricaWestern AsiaWestern EuropeYemenZaireZimbabweAzores
3rd Grade
Income
Poverty
Unemployment
Labor Participation
Family Structure
Vehicle Availability
Education Level
Disability

3rd Grade Comparison

Immigrants from Russia

Yaqui

Good
Tragic
97.8%
3RD GRADE
61.7/ 100
METRIC RATING
156th/ 347
METRIC RANK
97.3%
3RD GRADE
0.3/ 100
METRIC RATING
266th/ 347
METRIC RANK

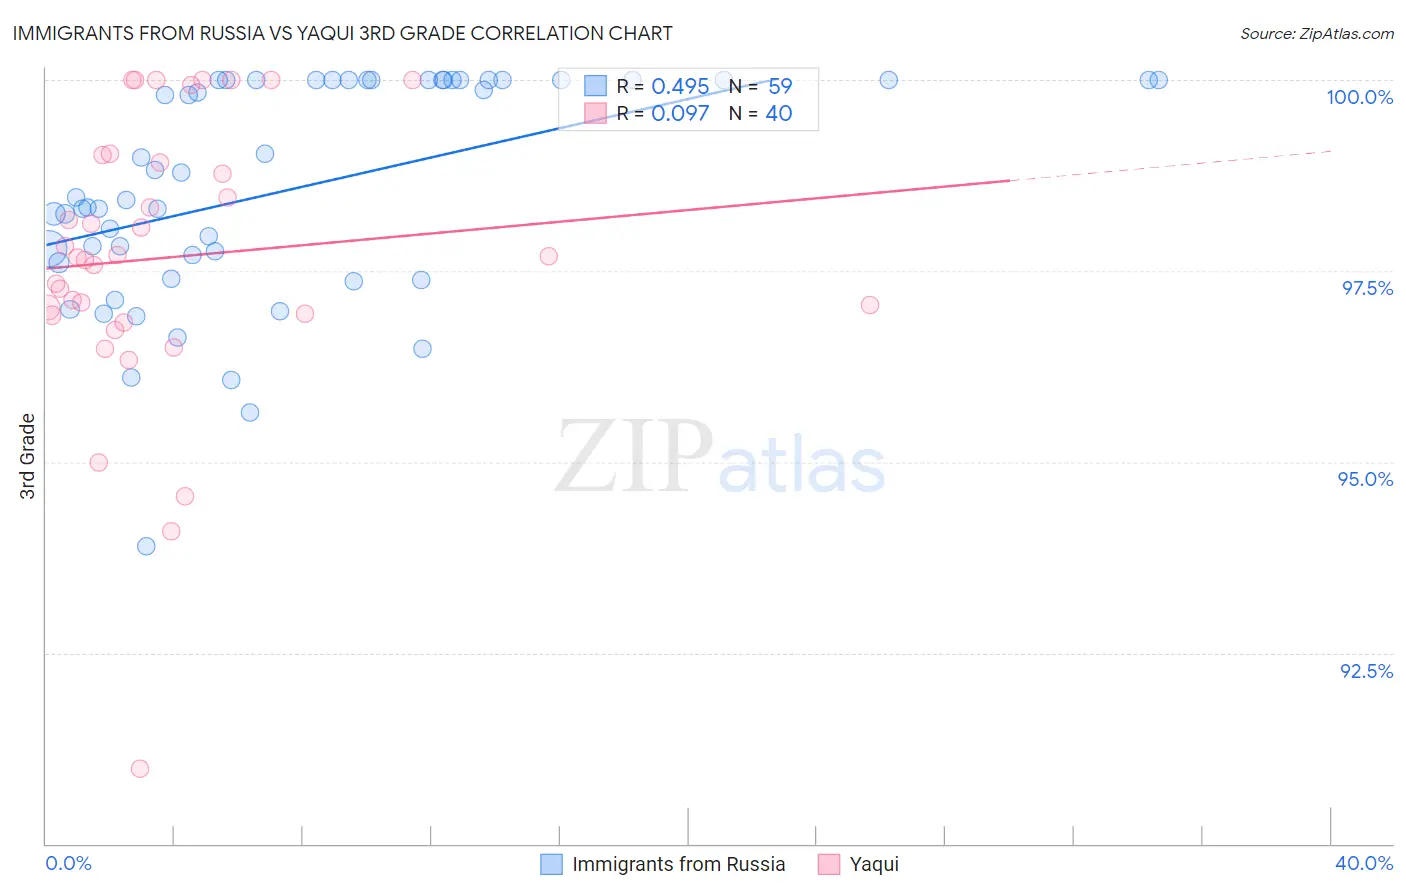
Immigrants from Russia vs Yaqui 3rd Grade Correlation Chart

The statistical analysis conducted on geographies consisting of 347,948,494 people shows a moderate positive correlation between the proportion of Immigrants from Russia and percentage of population with at least 3rd grade education in the United States with a correlation coefficient (R) of 0.495 and weighted average of 97.8%. Similarly, the statistical analysis conducted on geographies consisting of 107,732,380 people shows a slight positive correlation between the proportion of Yaqui and percentage of population with at least 3rd grade education in the United States with a correlation coefficient (R) of 0.097 and weighted average of 97.3%, a difference of 0.55%.
Immigrants from Russia vs Yaqui 3rd Grade

3rd Grade Correlation Summary

MeasurementImmigrants from RussiaYaqui
Minimum93.9%91.0%
Maximum100.0%100.0%
Range6.1%9.0%
Mean98.6%97.7%
Median98.5%97.7%
Interquartile 25% (IQ1)97.6%96.9%
Interquartile 75% (IQ3)100.0%99.0%
Interquartile Range (IQR)2.4%2.0%
Standard Deviation (Sample)1.5%1.9%
Standard Deviation (Population)1.4%1.8%

Similar Demographics by 3rd Grade

Demographics Similar to Immigrants from Russia by 3rd Grade

In terms of 3rd grade, the demographic groups most similar to Immigrants from Russia are Bermudan (97.8%, a difference of 0.0%), Immigrants from Italy (97.8%, a difference of 0.0%), Venezuelan (97.8%, a difference of 0.0%), Immigrants from Eastern Europe (97.8%, a difference of 0.010%), and French American Indian (97.8%, a difference of 0.010%).
DemographicsRating | Rank3rd Grade
Immigrants | North Macedonia
74.5
/100
|
#149
Good
97.8%
Jordanians
74.5
/100
|
#150
Good
97.8%
Soviet Union
72.6
/100
|
#151
Good
97.8%
Immigrants | South Central Asia
69.5
/100
|
#152
Good
97.8%
Apache
68.5
/100
|
#153
Good
97.8%
Immigrants | Eastern Europe
64.1
/100
|
#154
Good
97.8%
Bermudans
62.6
/100
|
#155
Good
97.8%
Immigrants | Russia
61.7
/100
|
#156
Good
97.8%
Immigrants | Italy
61.2
/100
|
#157
Good
97.8%
Venezuelans
60.9
/100
|
#158
Good
97.8%
French American Indians
60.0
/100
|
#159
Average
97.8%
Immigrants | Iran
59.1
/100
|
#160
Average
97.8%
Albanians
58.8
/100
|
#161
Average
97.8%
Immigrants | Jordan
57.9
/100
|
#162
Average
97.8%
Marshallese
57.2
/100
|
#163
Average
97.8%

Demographics Similar to Yaqui by 3rd Grade

In terms of 3rd grade, the demographic groups most similar to Yaqui are Immigrants from Nigeria (97.3%, a difference of 0.0%), Immigrants from Jamaica (97.3%, a difference of 0.010%), Cuban (97.3%, a difference of 0.010%), Fijian (97.3%, a difference of 0.010%), and Taiwanese (97.3%, a difference of 0.020%).
DemographicsRating | Rank3rd Grade
Armenians
0.4
/100
|
#259
Tragic
97.3%
Immigrants | Ethiopia
0.4
/100
|
#260
Tragic
97.3%
Immigrants | South America
0.4
/100
|
#261
Tragic
97.3%
Immigrants | Sierra Leone
0.4
/100
|
#262
Tragic
97.3%
Taiwanese
0.3
/100
|
#263
Tragic
97.3%
West Indians
0.3
/100
|
#264
Tragic
97.3%
Immigrants | Jamaica
0.3
/100
|
#265
Tragic
97.3%
Yaqui
0.3
/100
|
#266
Tragic
97.3%
Immigrants | Nigeria
0.3
/100
|
#267
Tragic
97.3%
Cubans
0.2
/100
|
#268
Tragic
97.3%
Fijians
0.2
/100
|
#269
Tragic
97.3%
Immigrants | China
0.2
/100
|
#270
Tragic
97.2%
Puerto Ricans
0.2
/100
|
#271
Tragic
97.2%
Ghanaians
0.1
/100
|
#272
Tragic
97.2%
Immigrants | Peru
0.1
/100
|
#273
Tragic
97.2%