Immigrants from Russia vs French 8th Grade

COMPARE

Immigrants from Russia
Race
Ancestry
AfghanAfricanAlaska NativeAlaskan AthabascanAlbanianAleutAlsatianAmericanApacheArabArapahoArgentineanArmenianAssyrian/Chaldean/SyriacAustralianAustrianBahamianBangladeshiBarbadianBasqueBelgianBelizeanBermudanBhutaneseBlackfeetBolivianBrazilianBritishBritish West IndianBulgarianBurmeseCajunCambodianCanadianCape VerdeanCarpatho RusynCelticCentral AmericanCentral American IndianCherokeeCheyenneChickasawChileanChineseChippewaChoctawColombianColvilleComancheCosta RicanCreeCreekCroatianCrowCubanCypriotCzechCzechoslovakianDanishDelawareDominicanDutchDutch West IndianEastern EuropeanEcuadorianEgyptianEnglishEstonianEthiopianEuropeanFijianFilipinoFinnishFrench American IndianFrench CanadianGermanGerman RussianGhanaianGreekGuamanian/ChamorroGuatemalanGuyaneseHaitianHmongHonduranHopiHoumaHungarianIcelanderIndian (Asian)IndonesianInupiatIranianIraqiIrishIroquoisIsraeliItalianJamaicanJapaneseJordanianKenyanKiowaKoreanLaotianLatvianLebaneseLiberianLithuanianLumbeeLuxembourgerMacedonianMalaysianMalteseMarshalleseMenomineeMexicanMexican American IndianMongolianMoroccanNative HawaiianNavajoNepaleseNew ZealanderNicaraguanNigerianNorthern EuropeanNorwegianOkinawanOsageOttawaPaiutePakistaniPalestinianPanamanianParaguayanPennsylvania GermanPeruvianPimaPolishPortuguesePotawatomiPuebloPuerto RicanPuget Sound SalishRomanianRussianSalvadoranSamoanScandinavianScotch-IrishScottishSeminoleSenegaleseSerbianShoshoneSierra LeoneanSiouxSlavicSlovakSloveneSomaliSouth AfricanSouth AmericanSouth American IndianSoviet UnionSpaniardSpanishSpanish AmericanSpanish American IndianSri LankanSubsaharan AfricanSudaneseSwedishSwissSyrianTaiwaneseThaiTlingit-HaidaTohono O'OdhamTonganTrinidadian and TobagonianTsimshianTurkishU.S. Virgin IslanderUgandanUkrainianUruguayanUteVenezuelanVietnameseWelshWest IndianYakamaYaquiYugoslavianYumanYup'ikZimbabwean
Immigration
NonimmigrantsImmigrantsAfghanistanAfricaAlbaniaArgentinaArmeniaAsiaAustraliaAustriaBahamasBangladeshBarbadosBelarusBelgiumBelizeBoliviaBosnia and HerzegovinaBrazilBulgariaBurma/MyanmarCabo VerdeCambodiaCameroonCanadaCaribbeanCentral AmericaChileChinaColombiaCongoCosta RicaCroatiaCubaCzechoslovakiaDenmarkDominicaDominican RepublicEastern AfricaEastern AsiaEastern EuropeEcuadorEgyptEl SalvadorEnglandEritreaEthiopiaEuropeFijiFranceGermanyGhanaGreeceGrenadaGuatemalaGuyanaHaitiHondurasHong KongHungaryIndiaIndonesiaIranIraqIrelandIsraelItalyJamaicaJapanJordanKazakhstanKenyaKoreaKuwaitLaosLatin AmericaLatviaLebanonLiberiaLithuaniaMalaysiaMexicoMicronesiaMiddle AfricaMoldovaMoroccoNepalNetherlandsNicaraguaNigeriaNorth AmericaNorth MacedoniaNorthern AfricaNorthern EuropeNorwayOceaniaPakistanPanamaPeruPhilippinesPolandPortugalRomaniaRussiaSaudi ArabiaScotlandSenegalSerbiaSierra LeoneSingaporeSomaliaSouth AfricaSouth AmericaSouth Central AsiaSouth Eastern AsiaSouthern EuropeSpainSri LankaSt. Vincent and the GrenadinesSudanSwedenSwitzerlandSyriaTaiwanThailandTrinidad and TobagoTurkeyUgandaUkraineUruguayUzbekistanVenezuelaVietnamWest IndiesWestern AfricaWestern AsiaWestern EuropeYemenZaireZimbabweAzores
French
Race
Ancestry
AfghanAfricanAlaska NativeAlaskan AthabascanAlbanianAleutAlsatianAmericanApacheArabArapahoArgentineanArmenianAssyrian/Chaldean/SyriacAustralianAustrianBahamianBangladeshiBarbadianBasqueBelgianBelizeanBermudanBhutaneseBlackfeetBolivianBrazilianBritishBritish West IndianBulgarianBurmeseCajunCambodianCanadianCape VerdeanCarpatho RusynCelticCentral AmericanCentral American IndianCherokeeCheyenneChickasawChileanChineseChippewaChoctawColombianColvilleComancheCosta RicanCreeCreekCroatianCrowCubanCypriotCzechCzechoslovakianDanishDelawareDominicanDutchDutch West IndianEastern EuropeanEcuadorianEgyptianEnglishEstonianEthiopianEuropeanFijianFilipinoFinnishFrenchFrench American IndianFrench CanadianGermanGerman RussianGhanaianGreekGuamanian/ChamorroGuatemalanGuyaneseHaitianHmongHonduranHopiHoumaHungarianIcelanderIndian (Asian)IndonesianInupiatIranianIraqiIrishIroquoisIsraeliItalianJamaicanJapaneseJordanianKenyanKiowaKoreanLaotianLatvianLebaneseLiberianLithuanianLumbeeLuxembourgerMacedonianMalaysianMalteseMarshalleseMenomineeMexicanMexican American IndianMongolianMoroccanNative HawaiianNavajoNepaleseNew ZealanderNicaraguanNigerianNorthern EuropeanNorwegianOkinawanOsageOttawaPaiutePakistaniPalestinianPanamanianParaguayanPennsylvania GermanPeruvianPimaPolishPortuguesePotawatomiPuebloPuerto RicanPuget Sound SalishRomanianRussianSalvadoranSamoanScandinavianScotch-IrishScottishSeminoleSenegaleseSerbianShoshoneSierra LeoneanSiouxSlavicSlovakSloveneSomaliSouth AfricanSouth AmericanSouth American IndianSoviet UnionSpaniardSpanishSpanish AmericanSpanish American IndianSri LankanSubsaharan AfricanSudaneseSwedishSwissSyrianTaiwaneseThaiTlingit-HaidaTohono O'OdhamTonganTrinidadian and TobagonianTsimshianTurkishU.S. Virgin IslanderUgandanUkrainianUruguayanUteVenezuelanVietnameseWelshWest IndianYakamaYaquiYugoslavianYumanYup'ikZimbabwean
Immigration
NonimmigrantsImmigrantsAfghanistanAfricaAlbaniaArgentinaArmeniaAsiaAustraliaAustriaBahamasBangladeshBarbadosBelarusBelgiumBelizeBoliviaBosnia and HerzegovinaBrazilBulgariaBurma/MyanmarCabo VerdeCambodiaCameroonCanadaCaribbeanCentral AmericaChileChinaColombiaCongoCosta RicaCroatiaCubaCzechoslovakiaDenmarkDominicaDominican RepublicEastern AfricaEastern AsiaEastern EuropeEcuadorEgyptEl SalvadorEnglandEritreaEthiopiaEuropeFijiFranceGermanyGhanaGreeceGrenadaGuatemalaGuyanaHaitiHondurasHong KongHungaryIndiaIndonesiaIranIraqIrelandIsraelItalyJamaicaJapanJordanKazakhstanKenyaKoreaKuwaitLaosLatin AmericaLatviaLebanonLiberiaLithuaniaMalaysiaMexicoMicronesiaMiddle AfricaMoldovaMoroccoNepalNetherlandsNicaraguaNigeriaNorth AmericaNorth MacedoniaNorthern AfricaNorthern EuropeNorwayOceaniaPakistanPanamaPeruPhilippinesPolandPortugalRomaniaSaudi ArabiaScotlandSenegalSerbiaSierra LeoneSingaporeSomaliaSouth AfricaSouth AmericaSouth Central AsiaSouth Eastern AsiaSouthern EuropeSpainSri LankaSt. Vincent and the GrenadinesSudanSwedenSwitzerlandSyriaTaiwanThailandTrinidad and TobagoTurkeyUgandaUkraineUruguayUzbekistanVenezuelaVietnamWest IndiesWestern AfricaWestern AsiaWestern EuropeYemenZaireZimbabweAzores
8th Grade
Income
Poverty
Unemployment
Labor Participation
Family Structure
Vehicle Availability
Education Level
Disability

8th Grade Comparison

Immigrants from Russia

French

Excellent
Exceptional
96.0%
8TH GRADE
80.9/ 100
METRIC RATING
150th/ 347
METRIC RANK
97.1%
8TH GRADE
100.0/ 100
METRIC RATING
26th/ 347
METRIC RANK

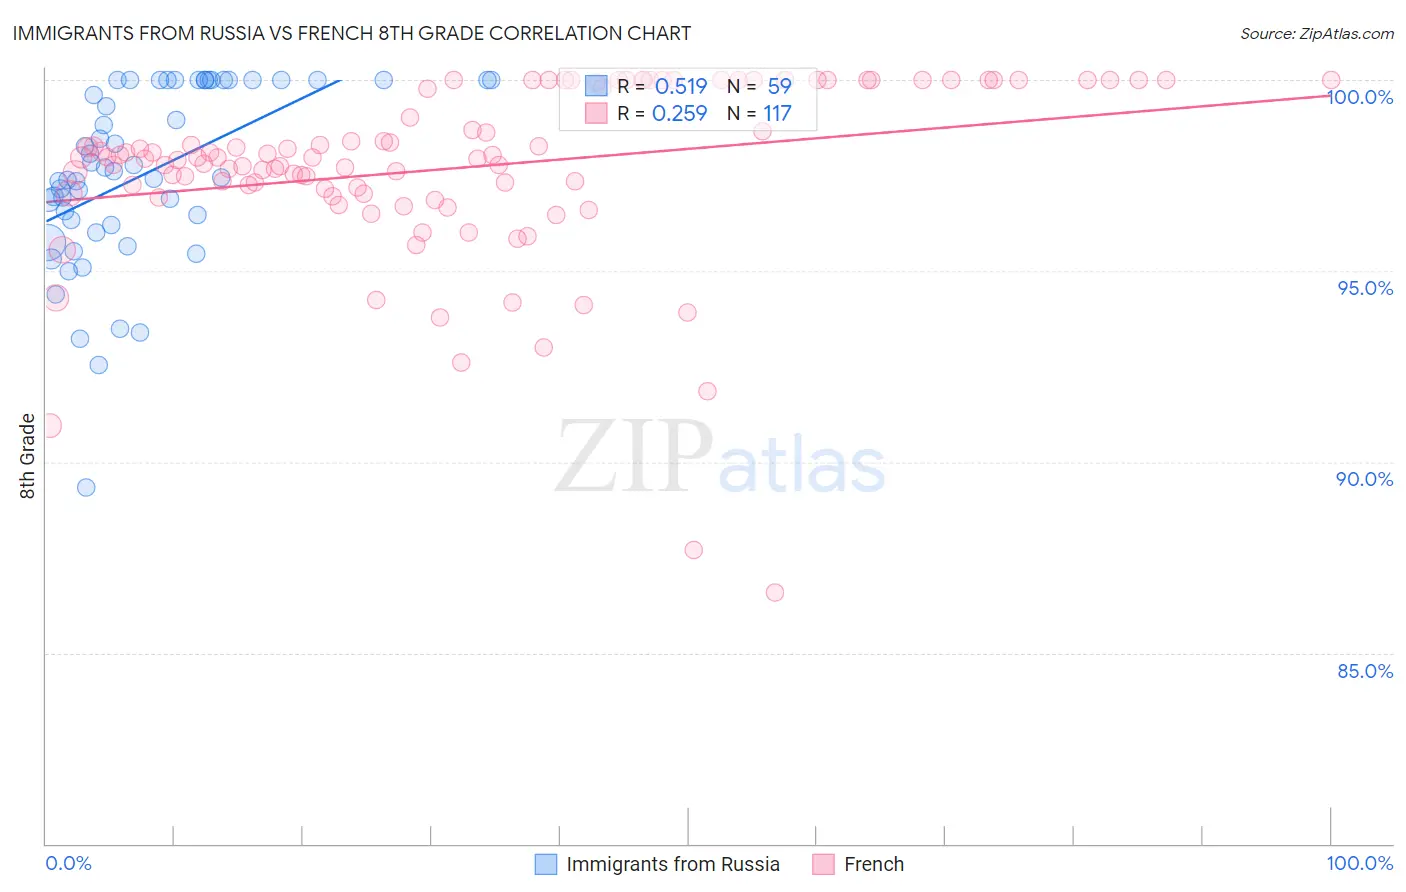
Immigrants from Russia vs French 8th Grade Correlation Chart

The statistical analysis conducted on geographies consisting of 347,948,494 people shows a substantial positive correlation between the proportion of Immigrants from Russia and percentage of population with at least 8th grade education in the United States with a correlation coefficient (R) of 0.519 and weighted average of 96.0%. Similarly, the statistical analysis conducted on geographies consisting of 572,427,255 people shows a weak positive correlation between the proportion of French and percentage of population with at least 8th grade education in the United States with a correlation coefficient (R) of 0.259 and weighted average of 97.1%, a difference of 1.2%.
Immigrants from Russia vs French 8th Grade

8th Grade Correlation Summary

MeasurementImmigrants from RussiaFrench
Minimum89.3%86.6%
Maximum100.0%100.0%
Range10.7%13.4%
Mean97.5%97.7%
Median97.6%98.0%
Interquartile 25% (IQ1)96.2%97.1%
Interquartile 75% (IQ3)100.0%100.0%
Interquartile Range (IQR)3.8%2.9%
Standard Deviation (Sample)2.3%2.4%
Standard Deviation (Population)2.3%2.3%

Similar Demographics by 8th Grade

Demographics Similar to Immigrants from Russia by 8th Grade

In terms of 8th grade, the demographic groups most similar to Immigrants from Russia are Immigrants from Israel (96.0%, a difference of 0.0%), Blackfeet (96.0%, a difference of 0.0%), French American Indian (96.0%, a difference of 0.0%), Immigrants from Jordan (95.9%, a difference of 0.010%), and Albanian (96.0%, a difference of 0.020%).
DemographicsRating | Rank8th Grade
Spanish
85.1
/100
|
#143
Excellent
96.0%
Immigrants | Belarus
84.8
/100
|
#144
Excellent
96.0%
Lumbee
84.1
/100
|
#145
Excellent
96.0%
Israelis
84.1
/100
|
#146
Excellent
96.0%
Colville
84.0
/100
|
#147
Excellent
96.0%
Albanians
83.1
/100
|
#148
Excellent
96.0%
Immigrants | Israel
81.3
/100
|
#149
Excellent
96.0%
Immigrants | Russia
80.9
/100
|
#150
Excellent
96.0%
Blackfeet
80.8
/100
|
#151
Excellent
96.0%
French American Indians
80.6
/100
|
#152
Excellent
96.0%
Immigrants | Jordan
79.5
/100
|
#153
Good
95.9%
Hopi
79.4
/100
|
#154
Good
95.9%
Kenyans
74.5
/100
|
#155
Good
95.9%
Ugandans
74.1
/100
|
#156
Good
95.9%
Immigrants | Taiwan
70.5
/100
|
#157
Good
95.9%

Demographics Similar to French by 8th Grade

In terms of 8th grade, the demographic groups most similar to French are Czech (97.1%, a difference of 0.0%), Scandinavian (97.2%, a difference of 0.010%), French Canadian (97.2%, a difference of 0.020%), Scotch-Irish (97.1%, a difference of 0.020%), and Welsh (97.2%, a difference of 0.030%).
DemographicsRating | Rank8th Grade
Scottish
100.0
/100
|
#19
Exceptional
97.3%
Croatians
100.0
/100
|
#20
Exceptional
97.2%
Danes
100.0
/100
|
#21
Exceptional
97.2%
Welsh
100.0
/100
|
#22
Exceptional
97.2%
French Canadians
100.0
/100
|
#23
Exceptional
97.2%
Scandinavians
100.0
/100
|
#24
Exceptional
97.2%
Czechs
100.0
/100
|
#25
Exceptional
97.1%
French
100.0
/100
|
#26
Exceptional
97.1%
Scotch-Irish
100.0
/100
|
#27
Exceptional
97.1%
Italians
100.0
/100
|
#28
Exceptional
97.1%
Europeans
100.0
/100
|
#29
Exceptional
97.1%
Sioux
100.0
/100
|
#30
Exceptional
97.1%
Chippewa
100.0
/100
|
#31
Exceptional
97.1%
Yup'ik
100.0
/100
|
#32
Exceptional
97.0%
Swiss
100.0
/100
|
#33
Exceptional
97.0%