Immigrants from Portugal vs Soviet Union No Schooling Completed
COMPARE
Immigrants from Portugal
Soviet Union
No Schooling Completed
No Schooling Completed Comparison
Immigrants from Portugal
Soviet Union
2.7%
NO SCHOOLING COMPLETED
0.0/ 100
METRIC RATING
286th/ 347
METRIC RANK
2.0%
NO SCHOOLING COMPLETED
77.1/ 100
METRIC RATING
147th/ 347
METRIC RANK
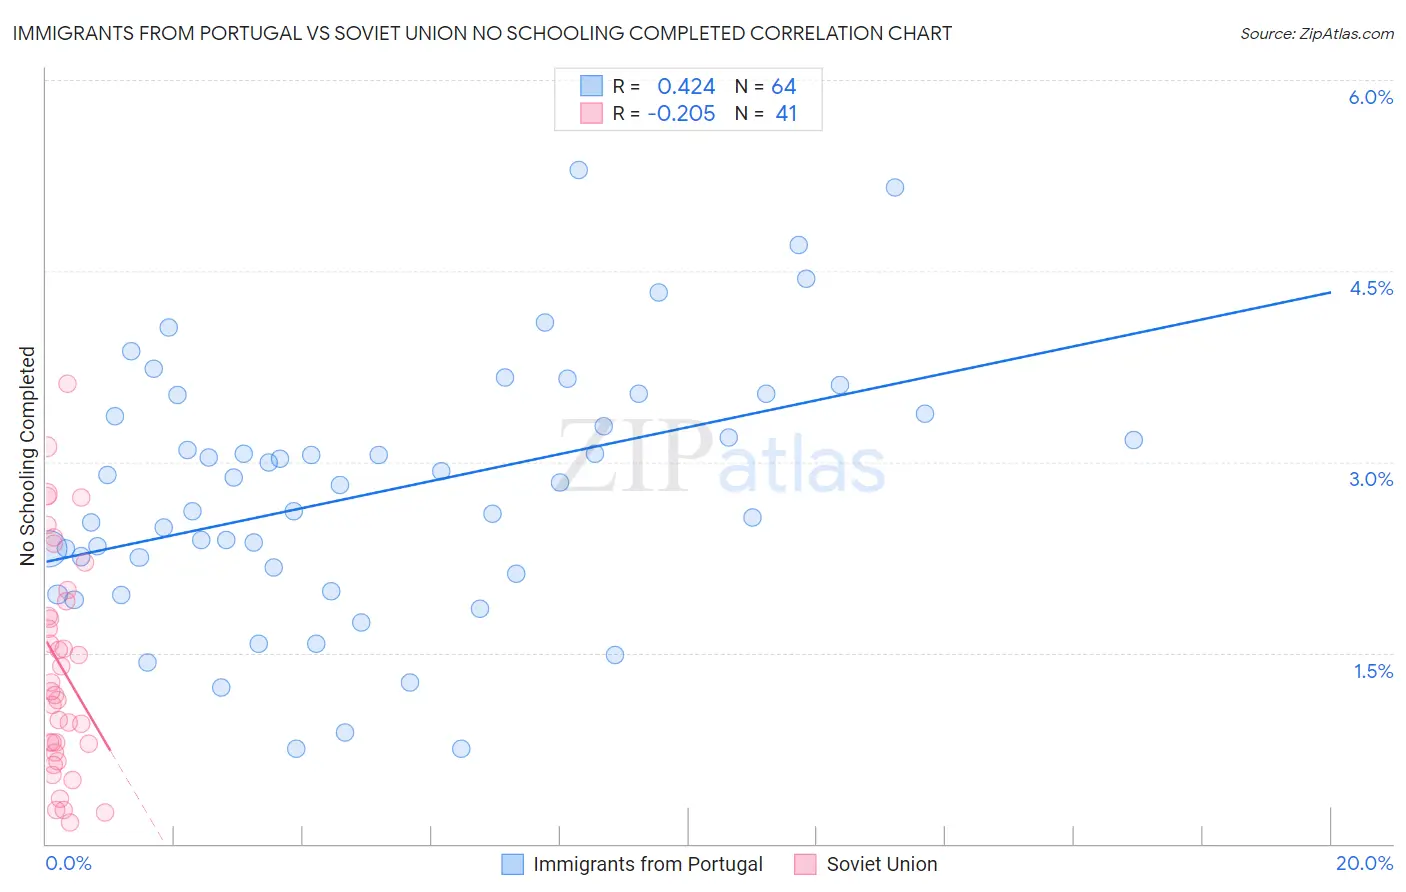
Immigrants from Portugal vs Soviet Union No Schooling Completed Correlation Chart
The statistical analysis conducted on geographies consisting of 174,032,123 people shows a moderate positive correlation between the proportion of Immigrants from Portugal and percentage of population with no schooling in the United States with a correlation coefficient (R) of 0.424 and weighted average of 2.7%. Similarly, the statistical analysis conducted on geographies consisting of 43,404,550 people shows a weak negative correlation between the proportion of Soviet Union and percentage of population with no schooling in the United States with a correlation coefficient (R) of -0.205 and weighted average of 2.0%, a difference of 33.0%.
No Schooling Completed Correlation Summary
| Measurement | Immigrants from Portugal | Soviet Union |
| Minimum | 0.74% | 0.17% |
| Maximum | 5.3% | 3.6% |
| Range | 4.6% | 3.4% |
| Mean | 2.8% | 1.4% |
| Median | 2.8% | 1.2% |
| Interquartile 25% (IQ1) | 2.1% | 0.75% |
| Interquartile 75% (IQ3) | 3.4% | 1.9% |
| Interquartile Range (IQR) | 1.2% | 1.2% |
| Standard Deviation (Sample) | 1.00% | 0.87% |
| Standard Deviation (Population) | 0.99% | 0.86% |
Similar Demographics by No Schooling Completed
Demographics Similar to Immigrants from Portugal by No Schooling Completed
In terms of no schooling completed, the demographic groups most similar to Immigrants from Portugal are Immigrants from Barbados (2.7%, a difference of 0.42%), Immigrants from West Indies (2.7%, a difference of 0.49%), Immigrants from Afghanistan (2.7%, a difference of 0.81%), Immigrants from St. Vincent and the Grenadines (2.7%, a difference of 0.91%), and Immigrants from Trinidad and Tobago (2.6%, a difference of 1.2%).
| Demographics | Rating | Rank | No Schooling Completed |
| Barbadians | 0.1 /100 | #279 | Tragic 2.6% |
| Trinidadians and Tobagonians | 0.1 /100 | #280 | Tragic 2.6% |
| Afghans | 0.1 /100 | #281 | Tragic 2.6% |
| Immigrants | Ghana | 0.1 /100 | #282 | Tragic 2.6% |
| Immigrants | Trinidad and Tobago | 0.0 /100 | #283 | Tragic 2.6% |
| Immigrants | West Indies | 0.0 /100 | #284 | Tragic 2.7% |
| Immigrants | Barbados | 0.0 /100 | #285 | Tragic 2.7% |
| Immigrants | Portugal | 0.0 /100 | #286 | Tragic 2.7% |
| Immigrants | Afghanistan | 0.0 /100 | #287 | Tragic 2.7% |
| Immigrants | St. Vincent and the Grenadines | 0.0 /100 | #288 | Tragic 2.7% |
| Immigrants | Thailand | 0.0 /100 | #289 | Tragic 2.7% |
| Immigrants | Hong Kong | 0.0 /100 | #290 | Tragic 2.7% |
| British West Indians | 0.0 /100 | #291 | Tragic 2.7% |
| Immigrants | Grenada | 0.0 /100 | #292 | Tragic 2.8% |
| Malaysians | 0.0 /100 | #293 | Tragic 2.8% |
Demographics Similar to Soviet Union by No Schooling Completed
In terms of no schooling completed, the demographic groups most similar to Soviet Union are Shoshone (2.0%, a difference of 0.080%), Immigrants from Moldova (2.0%, a difference of 0.17%), Immigrants from North Macedonia (2.0%, a difference of 0.24%), Immigrants from Iran (2.0%, a difference of 0.39%), and Alsatian (2.0%, a difference of 0.40%).
| Demographics | Rating | Rank | No Schooling Completed |
| Marshallese | 83.5 /100 | #140 | Excellent 2.0% |
| Immigrants | Greece | 83.5 /100 | #141 | Excellent 2.0% |
| Venezuelans | 81.5 /100 | #142 | Excellent 2.0% |
| Immigrants | South Central Asia | 80.0 /100 | #143 | Good 2.0% |
| Alsatians | 79.1 /100 | #144 | Good 2.0% |
| Immigrants | Iran | 79.0 /100 | #145 | Good 2.0% |
| Immigrants | Moldova | 78.0 /100 | #146 | Good 2.0% |
| Soviet Union | 77.1 /100 | #147 | Good 2.0% |
| Shoshone | 76.7 /100 | #148 | Good 2.0% |
| Immigrants | North Macedonia | 75.9 /100 | #149 | Good 2.0% |
| Blackfeet | 72.9 /100 | #150 | Good 2.0% |
| Immigrants | Jordan | 70.9 /100 | #151 | Good 2.0% |
| Immigrants | Eastern Europe | 70.4 /100 | #152 | Good 2.0% |
| Immigrants | Italy | 68.9 /100 | #153 | Good 2.0% |
| Immigrants | Venezuela | 68.5 /100 | #154 | Good 2.0% |