Immigrants from Portugal vs Immigrants from Ethiopia Kindergarten
COMPARE
Immigrants from Portugal
Immigrants from Ethiopia
Kindergarten
Kindergarten Comparison
Immigrants from Portugal
Immigrants from Ethiopia
97.3%
KINDERGARTEN
0.0/ 100
METRIC RATING
285th/ 347
METRIC RANK
97.5%
KINDERGARTEN
0.4/ 100
METRIC RATING
262nd/ 347
METRIC RANK
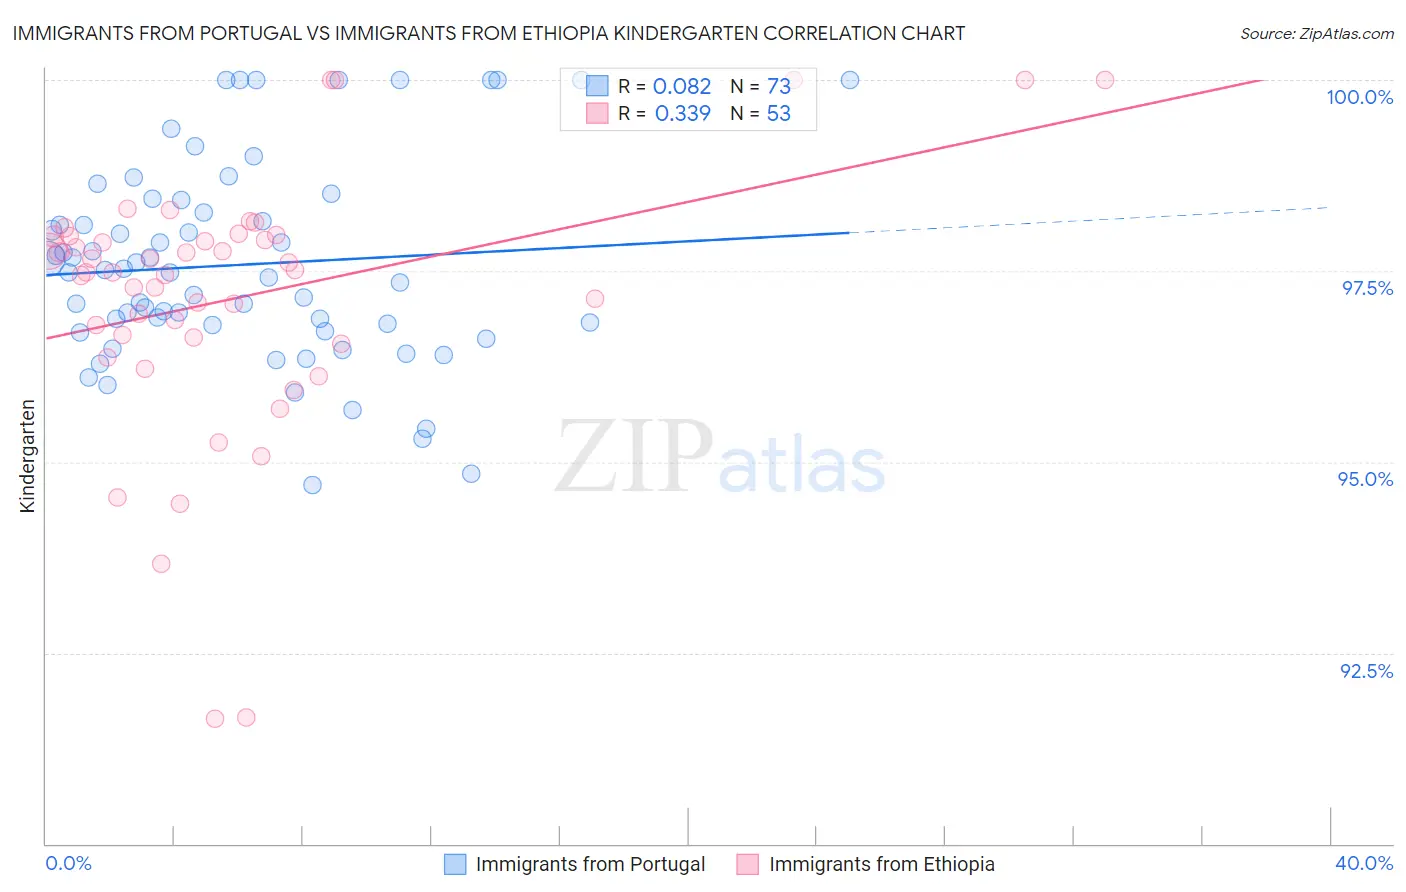
Immigrants from Portugal vs Immigrants from Ethiopia Kindergarten Correlation Chart
The statistical analysis conducted on geographies consisting of 174,792,107 people shows a slight positive correlation between the proportion of Immigrants from Portugal and percentage of population with at least kindergarten education in the United States with a correlation coefficient (R) of 0.082 and weighted average of 97.3%. Similarly, the statistical analysis conducted on geographies consisting of 211,539,400 people shows a mild positive correlation between the proportion of Immigrants from Ethiopia and percentage of population with at least kindergarten education in the United States with a correlation coefficient (R) of 0.339 and weighted average of 97.5%, a difference of 0.21%.
Kindergarten Correlation Summary
| Measurement | Immigrants from Portugal | Immigrants from Ethiopia |
| Minimum | 94.7% | 91.6% |
| Maximum | 100.0% | 100.0% |
| Range | 5.3% | 8.4% |
| Mean | 97.6% | 97.1% |
| Median | 97.5% | 97.5% |
| Interquartile 25% (IQ1) | 96.8% | 96.6% |
| Interquartile 75% (IQ3) | 98.3% | 98.0% |
| Interquartile Range (IQR) | 1.6% | 1.4% |
| Standard Deviation (Sample) | 1.3% | 1.7% |
| Standard Deviation (Population) | 1.3% | 1.7% |
Similar Demographics by Kindergarten
Demographics Similar to Immigrants from Portugal by Kindergarten
In terms of kindergarten, the demographic groups most similar to Immigrants from Portugal are Immigrants from Trinidad and Tobago (97.3%, a difference of 0.010%), Immigrants from Barbados (97.3%, a difference of 0.010%), Immigrants from Hong Kong (97.3%, a difference of 0.010%), Immigrants from West Indies (97.3%, a difference of 0.020%), and Immigrants from Thailand (97.3%, a difference of 0.020%).
| Demographics | Rating | Rank | Kindergarten |
| Immigrants | Uzbekistan | 0.1 /100 | #278 | Tragic 97.4% |
| Immigrants | Ghana | 0.1 /100 | #279 | Tragic 97.4% |
| Barbadians | 0.1 /100 | #280 | Tragic 97.4% |
| Trinidadians and Tobagonians | 0.1 /100 | #281 | Tragic 97.4% |
| Afghans | 0.0 /100 | #282 | Tragic 97.4% |
| Immigrants | West Indies | 0.0 /100 | #283 | Tragic 97.3% |
| Immigrants | Trinidad and Tobago | 0.0 /100 | #284 | Tragic 97.3% |
| Immigrants | Portugal | 0.0 /100 | #285 | Tragic 97.3% |
| Immigrants | Barbados | 0.0 /100 | #286 | Tragic 97.3% |
| Immigrants | Hong Kong | 0.0 /100 | #287 | Tragic 97.3% |
| Immigrants | Thailand | 0.0 /100 | #288 | Tragic 97.3% |
| Immigrants | Afghanistan | 0.0 /100 | #289 | Tragic 97.3% |
| Immigrants | St. Vincent and the Grenadines | 0.0 /100 | #290 | Tragic 97.3% |
| Houma | 0.0 /100 | #291 | Tragic 97.3% |
| British West Indians | 0.0 /100 | #292 | Tragic 97.3% |
Demographics Similar to Immigrants from Ethiopia by Kindergarten
In terms of kindergarten, the demographic groups most similar to Immigrants from Ethiopia are Taiwanese (97.5%, a difference of 0.0%), Immigrants from South America (97.5%, a difference of 0.0%), Assyrian/Chaldean/Syriac (97.5%, a difference of 0.0%), Armenian (97.6%, a difference of 0.010%), and Fijian (97.5%, a difference of 0.010%).
| Demographics | Rating | Rank | Kindergarten |
| Immigrants | Congo | 0.8 /100 | #255 | Tragic 97.6% |
| Yaqui | 0.7 /100 | #256 | Tragic 97.6% |
| Immigrants | Colombia | 0.6 /100 | #257 | Tragic 97.6% |
| Jamaicans | 0.6 /100 | #258 | Tragic 97.6% |
| Armenians | 0.5 /100 | #259 | Tragic 97.6% |
| Fijians | 0.5 /100 | #260 | Tragic 97.5% |
| Taiwanese | 0.4 /100 | #261 | Tragic 97.5% |
| Immigrants | Ethiopia | 0.4 /100 | #262 | Tragic 97.5% |
| Immigrants | South America | 0.4 /100 | #263 | Tragic 97.5% |
| Assyrians/Chaldeans/Syriacs | 0.4 /100 | #264 | Tragic 97.5% |
| Cubans | 0.3 /100 | #265 | Tragic 97.5% |
| Immigrants | Sierra Leone | 0.3 /100 | #266 | Tragic 97.5% |
| Immigrants | Liberia | 0.3 /100 | #267 | Tragic 97.5% |
| Immigrants | Nigeria | 0.3 /100 | #268 | Tragic 97.5% |
| West Indians | 0.3 /100 | #269 | Tragic 97.5% |