Immigrants from Portugal vs Blackfeet 5th Grade

COMPARE

Immigrants from Portugal
Race
Ancestry
AfghanAfricanAlaska NativeAlaskan AthabascanAlbanianAleutAlsatianAmericanApacheArabArapahoArgentineanArmenianAssyrian/Chaldean/SyriacAustralianAustrianBahamianBangladeshiBarbadianBasqueBelgianBelizeanBermudanBhutaneseBolivianBrazilianBritishBritish West IndianBulgarianBurmeseCajunCambodianCanadianCape VerdeanCarpatho RusynCelticCentral AmericanCentral American IndianCherokeeCheyenneChickasawChileanChineseChippewaChoctawColombianColvilleComancheCosta RicanCreeCreekCroatianCrowCubanCypriotCzechCzechoslovakianDanishDelawareDominicanDutchDutch West IndianEastern EuropeanEcuadorianEgyptianEnglishEstonianEthiopianEuropeanFijianFilipinoFinnishFrenchFrench American IndianFrench CanadianGermanGerman RussianGhanaianGreekGuamanian/ChamorroGuatemalanGuyaneseHaitianHmongHonduranHopiHoumaHungarianIcelanderIndian (Asian)IndonesianInupiatIranianIraqiIrishIroquoisIsraeliItalianJamaicanJapaneseJordanianKenyanKiowaKoreanLaotianLatvianLebaneseLiberianLithuanianLumbeeLuxembourgerMacedonianMalaysianMalteseMarshalleseMenomineeMexicanMexican American IndianMongolianMoroccanNative HawaiianNavajoNepaleseNew ZealanderNicaraguanNigerianNorthern EuropeanNorwegianOkinawanOsageOttawaPaiutePakistaniPalestinianPanamanianParaguayanPennsylvania GermanPeruvianPimaPolishPortuguesePotawatomiPuebloPuerto RicanPuget Sound SalishRomanianRussianSalvadoranSamoanScandinavianScotch-IrishScottishSeminoleSenegaleseSerbianShoshoneSierra LeoneanSiouxSlavicSlovakSloveneSomaliSouth AfricanSouth AmericanSouth American IndianSoviet UnionSpaniardSpanishSpanish AmericanSpanish American IndianSri LankanSubsaharan AfricanSudaneseSwedishSwissSyrianTaiwaneseThaiTlingit-HaidaTohono O'OdhamTonganTrinidadian and TobagonianTsimshianTurkishU.S. Virgin IslanderUgandanUkrainianUruguayanUteVenezuelanVietnameseWelshWest IndianYakamaYaquiYugoslavianYumanYup'ikZimbabwean
Immigration
NonimmigrantsImmigrantsAfghanistanAfricaAlbaniaArgentinaArmeniaAsiaAustraliaAustriaBahamasBangladeshBarbadosBelarusBelgiumBelizeBoliviaBosnia and HerzegovinaBrazilBulgariaBurma/MyanmarCabo VerdeCambodiaCameroonCanadaCaribbeanCentral AmericaChileChinaColombiaCongoCosta RicaCroatiaCubaCzechoslovakiaDenmarkDominicaDominican RepublicEastern AfricaEastern AsiaEastern EuropeEcuadorEgyptEl SalvadorEnglandEritreaEthiopiaEuropeFijiFranceGermanyGhanaGreeceGrenadaGuatemalaGuyanaHaitiHondurasHong KongHungaryIndiaIndonesiaIranIraqIrelandIsraelItalyJamaicaJapanJordanKazakhstanKenyaKoreaKuwaitLaosLatin AmericaLatviaLebanonLiberiaLithuaniaMalaysiaMexicoMicronesiaMiddle AfricaMoldovaMoroccoNepalNetherlandsNicaraguaNigeriaNorth AmericaNorth MacedoniaNorthern AfricaNorthern EuropeNorwayOceaniaPakistanPanamaPeruPhilippinesPolandPortugalRomaniaRussiaSaudi ArabiaScotlandSenegalSerbiaSierra LeoneSingaporeSomaliaSouth AfricaSouth AmericaSouth Central AsiaSouth Eastern AsiaSouthern EuropeSpainSri LankaSt. Vincent and the GrenadinesSudanSwedenSwitzerlandSyriaTaiwanThailandTrinidad and TobagoTurkeyUgandaUkraineUruguayUzbekistanVenezuelaVietnamWest IndiesWestern AfricaWestern AsiaWestern EuropeYemenZaireZimbabweAzores
Blackfeet
Race
Ancestry
AfghanAfricanAlaska NativeAlaskan AthabascanAlbanianAleutAlsatianAmericanApacheArabArapahoArgentineanArmenianAssyrian/Chaldean/SyriacAustralianAustrianBahamianBangladeshiBarbadianBasqueBelgianBelizeanBermudanBhutaneseBlackfeetBolivianBrazilianBritishBritish West IndianBulgarianBurmeseCajunCambodianCanadianCape VerdeanCarpatho RusynCelticCentral AmericanCentral American IndianCherokeeCheyenneChickasawChileanChineseChippewaChoctawColombianColvilleComancheCosta RicanCreeCreekCroatianCrowCubanCypriotCzechCzechoslovakianDanishDelawareDominicanDutchDutch West IndianEastern EuropeanEcuadorianEgyptianEnglishEstonianEthiopianEuropeanFijianFilipinoFinnishFrenchFrench American IndianFrench CanadianGermanGerman RussianGhanaianGreekGuamanian/ChamorroGuatemalanGuyaneseHaitianHmongHonduranHopiHoumaHungarianIcelanderIndian (Asian)IndonesianInupiatIranianIraqiIrishIroquoisIsraeliItalianJamaicanJapaneseJordanianKenyanKiowaKoreanLaotianLatvianLebaneseLiberianLithuanianLumbeeLuxembourgerMacedonianMalaysianMalteseMarshalleseMenomineeMexicanMexican American IndianMongolianMoroccanNative HawaiianNavajoNepaleseNew ZealanderNicaraguanNigerianNorthern EuropeanNorwegianOkinawanOsageOttawaPaiutePakistaniPalestinianPanamanianParaguayanPennsylvania GermanPeruvianPimaPolishPortuguesePotawatomiPuebloPuerto RicanPuget Sound SalishRomanianRussianSalvadoranSamoanScandinavianScotch-IrishScottishSeminoleSenegaleseSerbianShoshoneSierra LeoneanSiouxSlavicSlovakSloveneSomaliSouth AfricanSouth AmericanSouth American IndianSoviet UnionSpaniardSpanishSpanish AmericanSpanish American IndianSri LankanSubsaharan AfricanSudaneseSwedishSwissSyrianTaiwaneseThaiTlingit-HaidaTohono O'OdhamTonganTrinidadian and TobagonianTsimshianTurkishU.S. Virgin IslanderUgandanUkrainianUruguayanUteVenezuelanVietnameseWelshWest IndianYakamaYaquiYugoslavianYumanYup'ikZimbabwean
Immigration
NonimmigrantsImmigrantsAfghanistanAfricaAlbaniaArgentinaArmeniaAsiaAustraliaAustriaBahamasBangladeshBarbadosBelarusBelgiumBelizeBoliviaBosnia and HerzegovinaBrazilBulgariaBurma/MyanmarCabo VerdeCambodiaCameroonCanadaCaribbeanCentral AmericaChileChinaColombiaCongoCosta RicaCroatiaCubaCzechoslovakiaDenmarkDominicaDominican RepublicEastern AfricaEastern AsiaEastern EuropeEcuadorEgyptEl SalvadorEnglandEritreaEthiopiaEuropeFijiFranceGermanyGhanaGreeceGrenadaGuatemalaGuyanaHaitiHondurasHong KongHungaryIndiaIndonesiaIranIraqIrelandIsraelItalyJamaicaJapanJordanKazakhstanKenyaKoreaKuwaitLaosLatin AmericaLatviaLebanonLiberiaLithuaniaMalaysiaMexicoMicronesiaMiddle AfricaMoldovaMoroccoNepalNetherlandsNicaraguaNigeriaNorth AmericaNorth MacedoniaNorthern AfricaNorthern EuropeNorwayOceaniaPakistanPanamaPeruPhilippinesPolandRomaniaRussiaSaudi ArabiaScotlandSenegalSerbiaSierra LeoneSingaporeSomaliaSouth AfricaSouth AmericaSouth Central AsiaSouth Eastern AsiaSouthern EuropeSpainSri LankaSt. Vincent and the GrenadinesSudanSwedenSwitzerlandSyriaTaiwanThailandTrinidad and TobagoTurkeyUgandaUkraineUruguayUzbekistanVenezuelaVietnamWest IndiesWestern AfricaWestern AsiaWestern EuropeYemenZaireZimbabweAzores
5th Grade
Income
Poverty
Unemployment
Labor Participation
Family Structure
Vehicle Availability
Education Level
Disability

5th Grade Comparison

Immigrants from Portugal

Blackfeet

Tragic
Excellent
95.9%
5TH GRADE
0.0/ 100
METRIC RATING
314th/ 347
METRIC RANK
97.5%
5TH GRADE
86.8/ 100
METRIC RATING
138th/ 347
METRIC RANK

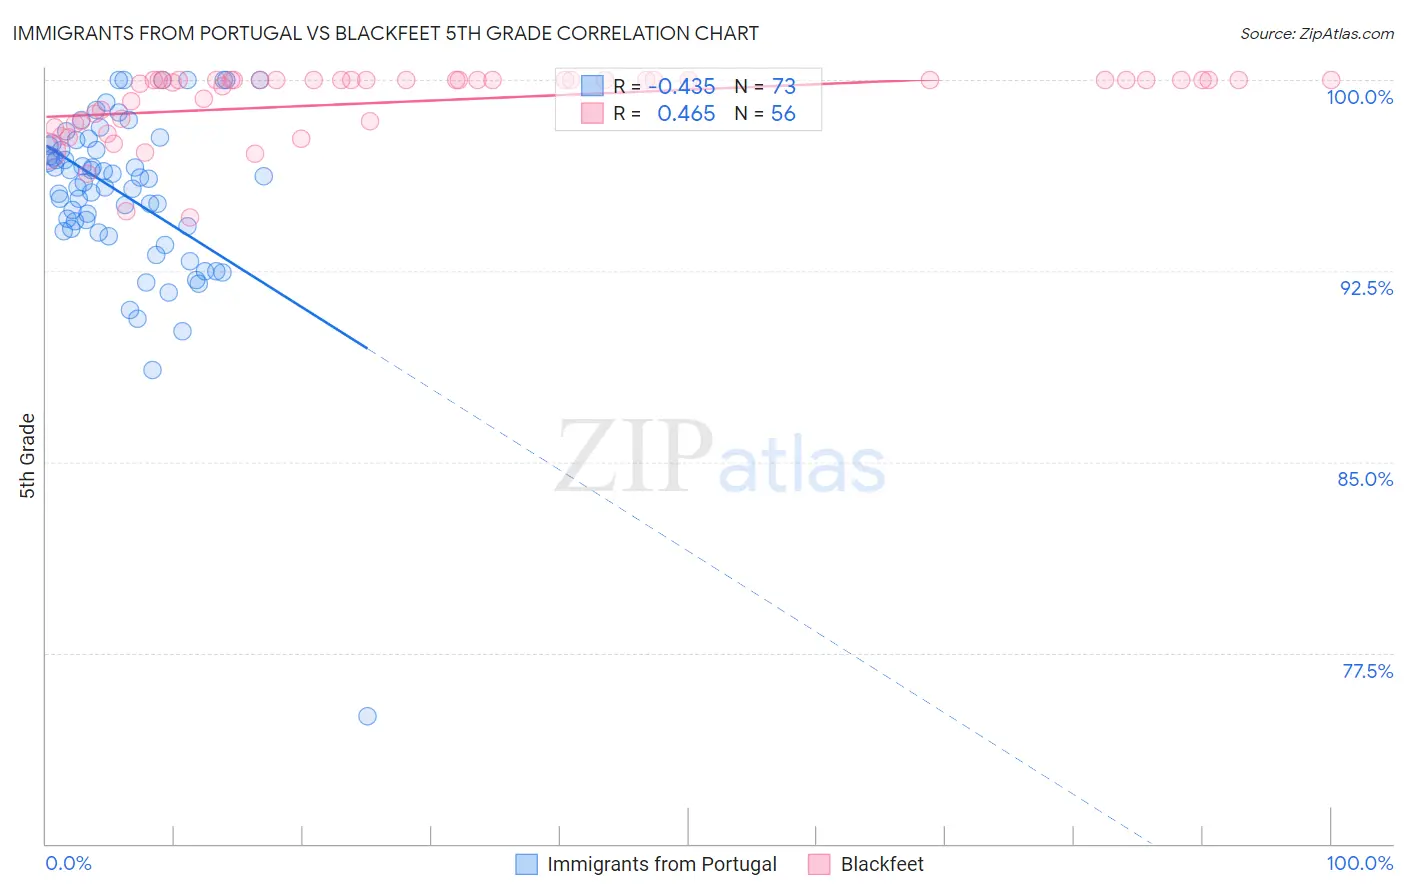
Immigrants from Portugal vs Blackfeet 5th Grade Correlation Chart

The statistical analysis conducted on geographies consisting of 174,792,107 people shows a moderate negative correlation between the proportion of Immigrants from Portugal and percentage of population with at least 5th grade education in the United States with a correlation coefficient (R) of -0.435 and weighted average of 95.9%. Similarly, the statistical analysis conducted on geographies consisting of 309,580,957 people shows a moderate positive correlation between the proportion of Blackfeet and percentage of population with at least 5th grade education in the United States with a correlation coefficient (R) of 0.465 and weighted average of 97.5%, a difference of 1.7%.
Immigrants from Portugal vs Blackfeet 5th Grade

5th Grade Correlation Summary

MeasurementImmigrants from PortugalBlackfeet
Minimum75.0%94.6%
Maximum100.0%100.0%
Range25.0%5.4%
Mean95.5%99.2%
Median96.1%100.0%
Interquartile 25% (IQ1)94.1%98.4%
Interquartile 75% (IQ3)97.5%100.0%
Interquartile Range (IQR)3.4%1.6%
Standard Deviation (Sample)3.5%1.3%
Standard Deviation (Population)3.5%1.3%

Similar Demographics by 5th Grade

Demographics Similar to Immigrants from Portugal by 5th Grade

In terms of 5th grade, the demographic groups most similar to Immigrants from Portugal are Bangladeshi (95.9%, a difference of 0.0%), Vietnamese (95.9%, a difference of 0.020%), Nicaraguan (95.9%, a difference of 0.020%), Immigrants from Bangladesh (96.0%, a difference of 0.050%), and Indonesian (96.0%, a difference of 0.070%).
DemographicsRating | Rank5th Grade
Immigrants | Caribbean
0.0
/100
|
#307
Tragic
96.0%
Ecuadorians
0.0
/100
|
#308
Tragic
96.0%
Immigrants | Guyana
0.0
/100
|
#309
Tragic
96.0%
Indonesians
0.0
/100
|
#310
Tragic
96.0%
Immigrants | Bangladesh
0.0
/100
|
#311
Tragic
96.0%
Vietnamese
0.0
/100
|
#312
Tragic
95.9%
Bangladeshis
0.0
/100
|
#313
Tragic
95.9%
Immigrants | Portugal
0.0
/100
|
#314
Tragic
95.9%
Nicaraguans
0.0
/100
|
#315
Tragic
95.9%
Immigrants | Ecuador
0.0
/100
|
#316
Tragic
95.8%
Belizeans
0.0
/100
|
#317
Tragic
95.8%
Immigrants | Vietnam
0.0
/100
|
#318
Tragic
95.8%
Japanese
0.0
/100
|
#319
Tragic
95.7%
Central American Indians
0.0
/100
|
#320
Tragic
95.7%
Immigrants | Belize
0.0
/100
|
#321
Tragic
95.7%

Demographics Similar to Blackfeet by 5th Grade

In terms of 5th grade, the demographic groups most similar to Blackfeet are Filipino (97.5%, a difference of 0.0%), Immigrants from Turkey (97.5%, a difference of 0.0%), Immigrants from Moldova (97.5%, a difference of 0.010%), Burmese (97.5%, a difference of 0.010%), and Seminole (97.5%, a difference of 0.010%).
DemographicsRating | Rank5th Grade
Pima
91.2
/100
|
#131
Exceptional
97.6%
Immigrants | Kuwait
90.4
/100
|
#132
Exceptional
97.6%
Cambodians
90.2
/100
|
#133
Exceptional
97.6%
Immigrants | Hungary
90.1
/100
|
#134
Exceptional
97.6%
Palestinians
89.3
/100
|
#135
Excellent
97.5%
Immigrants | Moldova
87.5
/100
|
#136
Excellent
97.5%
Filipinos
86.8
/100
|
#137
Excellent
97.5%
Blackfeet
86.8
/100
|
#138
Excellent
97.5%
Immigrants | Turkey
86.7
/100
|
#139
Excellent
97.5%
Burmese
86.1
/100
|
#140
Excellent
97.5%
Seminole
85.8
/100
|
#141
Excellent
97.5%
Israelis
85.5
/100
|
#142
Excellent
97.5%
Immigrants | North Macedonia
85.4
/100
|
#143
Excellent
97.5%
Immigrants | Greece
83.2
/100
|
#144
Excellent
97.5%
Jordanians
82.6
/100
|
#145
Excellent
97.5%