Immigrants from Poland vs Sioux 2nd Grade

COMPARE

Immigrants from Poland
Race
Ancestry
AfghanAfricanAlaska NativeAlaskan AthabascanAlbanianAleutAlsatianAmericanApacheArabArapahoArgentineanArmenianAssyrian/Chaldean/SyriacAustralianAustrianBahamianBangladeshiBarbadianBasqueBelgianBelizeanBermudanBhutaneseBlackfeetBolivianBrazilianBritishBritish West IndianBulgarianBurmeseCajunCambodianCanadianCape VerdeanCarpatho RusynCelticCentral AmericanCentral American IndianCherokeeCheyenneChickasawChileanChineseChippewaChoctawColombianColvilleComancheCosta RicanCreeCreekCroatianCrowCubanCypriotCzechCzechoslovakianDanishDelawareDominicanDutchDutch West IndianEastern EuropeanEcuadorianEgyptianEnglishEstonianEthiopianEuropeanFijianFilipinoFinnishFrenchFrench American IndianFrench CanadianGermanGerman RussianGhanaianGreekGuamanian/ChamorroGuatemalanGuyaneseHaitianHmongHonduranHopiHoumaHungarianIcelanderIndian (Asian)IndonesianInupiatIranianIraqiIrishIroquoisIsraeliItalianJamaicanJapaneseJordanianKenyanKiowaKoreanLaotianLatvianLebaneseLiberianLithuanianLumbeeLuxembourgerMacedonianMalaysianMalteseMarshalleseMenomineeMexicanMexican American IndianMongolianMoroccanNative HawaiianNavajoNepaleseNew ZealanderNicaraguanNigerianNorthern EuropeanNorwegianOkinawanOsageOttawaPaiutePakistaniPalestinianPanamanianParaguayanPennsylvania GermanPeruvianPimaPolishPortuguesePotawatomiPuebloPuerto RicanPuget Sound SalishRomanianRussianSalvadoranSamoanScandinavianScotch-IrishScottishSeminoleSenegaleseSerbianShoshoneSierra LeoneanSlavicSlovakSloveneSomaliSouth AfricanSouth AmericanSouth American IndianSoviet UnionSpaniardSpanishSpanish AmericanSpanish American IndianSri LankanSubsaharan AfricanSudaneseSwedishSwissSyrianTaiwaneseThaiTlingit-HaidaTohono O'OdhamTonganTrinidadian and TobagonianTsimshianTurkishU.S. Virgin IslanderUgandanUkrainianUruguayanUteVenezuelanVietnameseWelshWest IndianYakamaYaquiYugoslavianYumanYup'ikZimbabwean
Immigration
NonimmigrantsImmigrantsAfghanistanAfricaAlbaniaArgentinaArmeniaAsiaAustraliaAustriaBahamasBangladeshBarbadosBelarusBelgiumBelizeBoliviaBosnia and HerzegovinaBrazilBulgariaBurma/MyanmarCabo VerdeCambodiaCameroonCanadaCaribbeanCentral AmericaChileChinaColombiaCongoCosta RicaCroatiaCubaCzechoslovakiaDenmarkDominicaDominican RepublicEastern AfricaEastern AsiaEastern EuropeEcuadorEgyptEl SalvadorEnglandEritreaEthiopiaEuropeFijiFranceGermanyGhanaGreeceGrenadaGuatemalaGuyanaHaitiHondurasHong KongHungaryIndiaIndonesiaIranIraqIrelandIsraelItalyJamaicaJapanJordanKazakhstanKenyaKoreaKuwaitLaosLatin AmericaLatviaLebanonLiberiaLithuaniaMalaysiaMexicoMicronesiaMiddle AfricaMoldovaMoroccoNepalNetherlandsNicaraguaNigeriaNorth AmericaNorth MacedoniaNorthern AfricaNorthern EuropeNorwayOceaniaPakistanPanamaPeruPhilippinesPolandPortugalRomaniaRussiaSaudi ArabiaScotlandSenegalSerbiaSierra LeoneSingaporeSomaliaSouth AfricaSouth AmericaSouth Central AsiaSouth Eastern AsiaSouthern EuropeSpainSri LankaSt. Vincent and the GrenadinesSudanSwedenSwitzerlandSyriaTaiwanThailandTrinidad and TobagoTurkeyUgandaUkraineUruguayUzbekistanVenezuelaVietnamWest IndiesWestern AfricaWestern AsiaWestern EuropeYemenZaireZimbabweAzores
Sioux
Race
Ancestry
AfghanAfricanAlaska NativeAlaskan AthabascanAlbanianAleutAlsatianAmericanApacheArabArapahoArgentineanArmenianAssyrian/Chaldean/SyriacAustralianAustrianBahamianBangladeshiBarbadianBasqueBelgianBelizeanBermudanBhutaneseBlackfeetBolivianBrazilianBritishBritish West IndianBulgarianBurmeseCajunCambodianCanadianCape VerdeanCarpatho RusynCelticCentral AmericanCentral American IndianCherokeeCheyenneChickasawChileanChineseChippewaChoctawColombianColvilleComancheCosta RicanCreeCreekCroatianCrowCubanCypriotCzechCzechoslovakianDanishDelawareDominicanDutchDutch West IndianEastern EuropeanEcuadorianEgyptianEnglishEstonianEthiopianEuropeanFijianFilipinoFinnishFrenchFrench American IndianFrench CanadianGermanGerman RussianGhanaianGreekGuamanian/ChamorroGuatemalanGuyaneseHaitianHmongHonduranHopiHoumaHungarianIcelanderIndian (Asian)IndonesianInupiatIranianIraqiIrishIroquoisIsraeliItalianJamaicanJapaneseJordanianKenyanKiowaKoreanLaotianLatvianLebaneseLiberianLithuanianLumbeeLuxembourgerMacedonianMalaysianMalteseMarshalleseMenomineeMexicanMexican American IndianMongolianMoroccanNative HawaiianNavajoNepaleseNew ZealanderNicaraguanNigerianNorthern EuropeanNorwegianOkinawanOsageOttawaPaiutePakistaniPalestinianPanamanianParaguayanPennsylvania GermanPeruvianPimaPolishPortuguesePotawatomiPuebloPuerto RicanPuget Sound SalishRomanianRussianSalvadoranSamoanScandinavianScotch-IrishScottishSeminoleSenegaleseSerbianShoshoneSierra LeoneanSiouxSlavicSlovakSloveneSomaliSouth AfricanSouth AmericanSouth American IndianSoviet UnionSpaniardSpanishSpanish AmericanSpanish American IndianSri LankanSubsaharan AfricanSudaneseSwedishSwissSyrianTaiwaneseThaiTlingit-HaidaTohono O'OdhamTonganTrinidadian and TobagonianTsimshianTurkishU.S. Virgin IslanderUgandanUkrainianUruguayanUteVenezuelanVietnameseWelshWest IndianYakamaYaquiYugoslavianYumanYup'ikZimbabwean
Immigration
NonimmigrantsImmigrantsAfghanistanAfricaAlbaniaArgentinaArmeniaAsiaAustraliaAustriaBahamasBangladeshBarbadosBelarusBelgiumBelizeBoliviaBosnia and HerzegovinaBrazilBulgariaBurma/MyanmarCabo VerdeCambodiaCameroonCanadaCaribbeanCentral AmericaChileChinaColombiaCongoCosta RicaCroatiaCubaCzechoslovakiaDenmarkDominicaDominican RepublicEastern AfricaEastern AsiaEastern EuropeEcuadorEgyptEl SalvadorEnglandEritreaEthiopiaEuropeFijiFranceGermanyGhanaGreeceGrenadaGuatemalaGuyanaHaitiHondurasHong KongHungaryIndiaIndonesiaIranIraqIrelandIsraelItalyJamaicaJapanJordanKazakhstanKenyaKoreaKuwaitLaosLatin AmericaLatviaLebanonLiberiaLithuaniaMalaysiaMexicoMicronesiaMiddle AfricaMoldovaMoroccoNepalNetherlandsNicaraguaNigeriaNorth AmericaNorth MacedoniaNorthern AfricaNorthern EuropeNorwayOceaniaPakistanPanamaPeruPhilippinesPortugalRomaniaRussiaSaudi ArabiaScotlandSenegalSerbiaSierra LeoneSingaporeSomaliaSouth AfricaSouth AmericaSouth Central AsiaSouth Eastern AsiaSouthern EuropeSpainSri LankaSt. Vincent and the GrenadinesSudanSwedenSwitzerlandSyriaTaiwanThailandTrinidad and TobagoTurkeyUgandaUkraineUruguayUzbekistanVenezuelaVietnamWest IndiesWestern AfricaWestern AsiaWestern EuropeYemenZaireZimbabweAzores
2nd Grade
Income
Poverty
Unemployment
Labor Participation
Family Structure
Vehicle Availability
Education Level
Disability

2nd Grade Comparison

Immigrants from Poland

Sioux

Average
Exceptional
97.8%
2ND GRADE
42.2/ 100
METRIC RATING
183rd/ 347
METRIC RANK
98.5%
2ND GRADE
100.0/ 100
METRIC RATING
20th/ 347
METRIC RANK

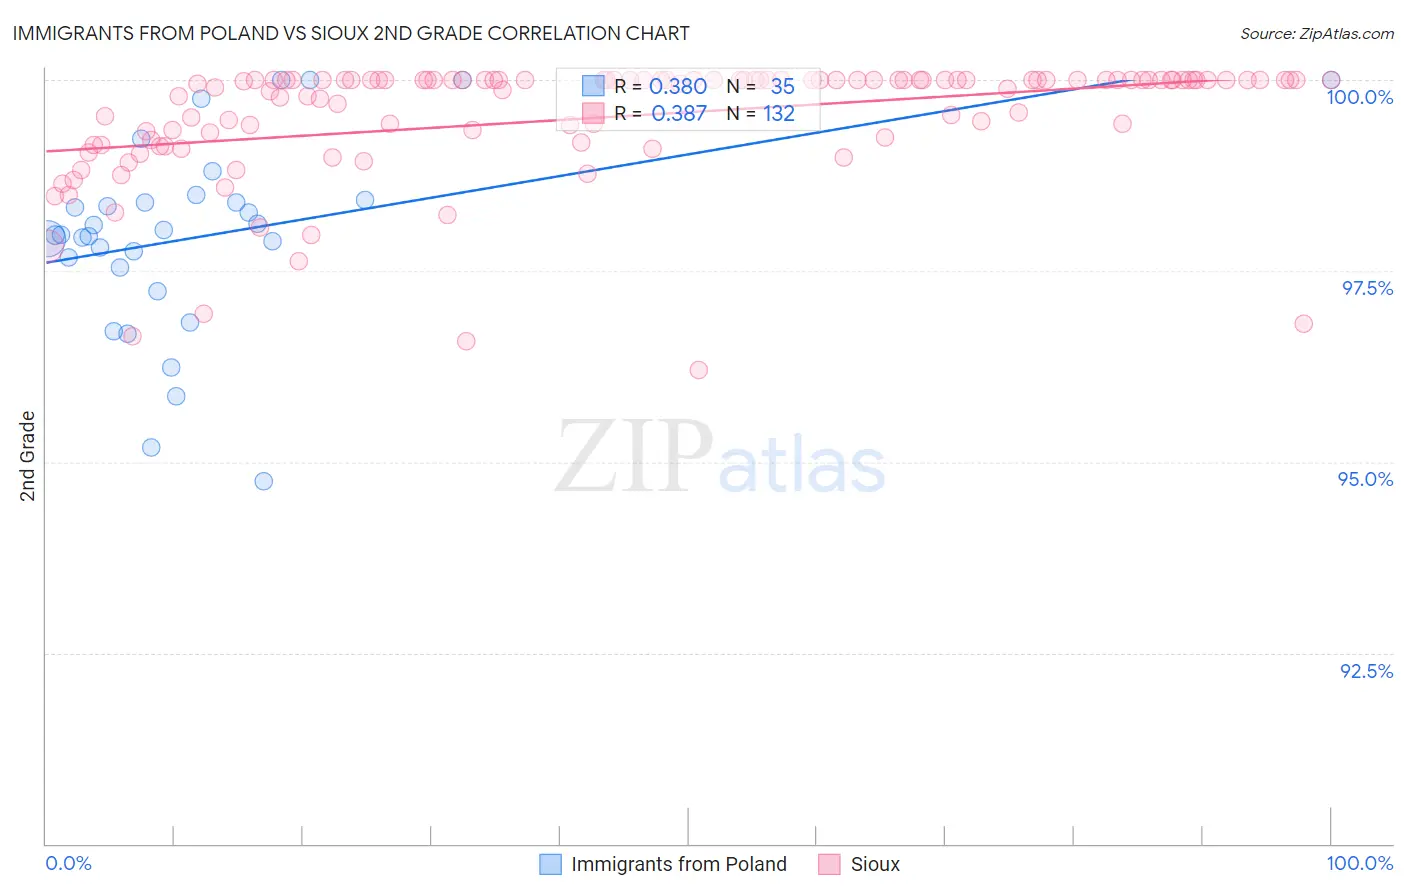
Immigrants from Poland vs Sioux 2nd Grade Correlation Chart

The statistical analysis conducted on geographies consisting of 304,861,559 people shows a mild positive correlation between the proportion of Immigrants from Poland and percentage of population with at least 2nd grade education in the United States with a correlation coefficient (R) of 0.380 and weighted average of 97.8%. Similarly, the statistical analysis conducted on geographies consisting of 234,197,392 people shows a mild positive correlation between the proportion of Sioux and percentage of population with at least 2nd grade education in the United States with a correlation coefficient (R) of 0.387 and weighted average of 98.5%, a difference of 0.72%.
Immigrants from Poland vs Sioux 2nd Grade

2nd Grade Correlation Summary

MeasurementImmigrants from PolandSioux
Minimum94.8%96.2%
Maximum100.0%100.0%
Range5.2%3.8%
Mean98.0%99.5%
Median98.0%100.0%
Interquartile 25% (IQ1)97.5%99.2%
Interquartile 75% (IQ3)98.4%100.0%
Interquartile Range (IQR)0.89%0.80%
Standard Deviation (Sample)1.3%0.80%
Standard Deviation (Population)1.2%0.79%

Similar Demographics by 2nd Grade

Demographics Similar to Immigrants from Poland by 2nd Grade

In terms of 2nd grade, the demographic groups most similar to Immigrants from Poland are Portuguese (97.8%, a difference of 0.0%), Immigrants from Belarus (97.8%, a difference of 0.0%), Immigrants from Brazil (97.9%, a difference of 0.010%), Argentinean (97.9%, a difference of 0.010%), and Immigrants from Venezuela (97.9%, a difference of 0.010%).
DemographicsRating | Rank2nd Grade
Immigrants | Sri Lanka
48.7
/100
|
#176
Average
97.9%
Immigrants | Brazil
46.6
/100
|
#177
Average
97.9%
Argentineans
46.3
/100
|
#178
Average
97.9%
Immigrants | Venezuela
46.1
/100
|
#179
Average
97.9%
Natives/Alaskans
44.3
/100
|
#180
Average
97.9%
Egyptians
44.3
/100
|
#181
Average
97.9%
Portuguese
42.4
/100
|
#182
Average
97.8%
Immigrants | Poland
42.2
/100
|
#183
Average
97.8%
Immigrants | Belarus
41.5
/100
|
#184
Average
97.8%
Immigrants | Argentina
40.6
/100
|
#185
Average
97.8%
Arabs
36.9
/100
|
#186
Fair
97.8%
Pakistanis
36.1
/100
|
#187
Fair
97.8%
Immigrants | Kazakhstan
35.6
/100
|
#188
Fair
97.8%
Panamanians
33.5
/100
|
#189
Fair
97.8%
Immigrants | Taiwan
31.8
/100
|
#190
Fair
97.8%

Demographics Similar to Sioux by 2nd Grade

In terms of 2nd grade, the demographic groups most similar to Sioux are Finnish (98.5%, a difference of 0.0%), Lithuanian (98.5%, a difference of 0.0%), Polish (98.5%, a difference of 0.0%), Danish (98.5%, a difference of 0.0%), and Pennsylvania German (98.5%, a difference of 0.0%).
DemographicsRating | Rank2nd Grade
English
100.0
/100
|
#13
Exceptional
98.6%
Swedes
100.0
/100
|
#14
Exceptional
98.6%
Scottish
100.0
/100
|
#15
Exceptional
98.6%
Dutch
100.0
/100
|
#16
Exceptional
98.6%
Aleuts
100.0
/100
|
#17
Exceptional
98.6%
Irish
100.0
/100
|
#18
Exceptional
98.6%
Finns
100.0
/100
|
#19
Exceptional
98.5%
Sioux
100.0
/100
|
#20
Exceptional
98.5%
Lithuanians
100.0
/100
|
#21
Exceptional
98.5%
Poles
100.0
/100
|
#22
Exceptional
98.5%
Danes
100.0
/100
|
#23
Exceptional
98.5%
Pennsylvania Germans
100.0
/100
|
#24
Exceptional
98.5%
Scotch-Irish
100.0
/100
|
#25
Exceptional
98.5%
Welsh
100.0
/100
|
#26
Exceptional
98.5%
Croatians
100.0
/100
|
#27
Exceptional
98.5%