Immigrants from Peru vs Thai Bachelor's Degree

COMPARE

Immigrants from Peru
Race
Ancestry
AfghanAfricanAlaska NativeAlaskan AthabascanAlbanianAleutAlsatianAmericanApacheArabArapahoArgentineanArmenianAssyrian/Chaldean/SyriacAustralianAustrianBahamianBangladeshiBarbadianBasqueBelgianBelizeanBermudanBhutaneseBlackfeetBolivianBrazilianBritishBritish West IndianBulgarianBurmeseCajunCambodianCanadianCape VerdeanCarpatho RusynCelticCentral AmericanCentral American IndianCherokeeCheyenneChickasawChileanChineseChippewaChoctawColombianColvilleComancheCosta RicanCreeCreekCroatianCrowCubanCypriotCzechCzechoslovakianDanishDelawareDominicanDutchDutch West IndianEastern EuropeanEcuadorianEgyptianEnglishEstonianEthiopianEuropeanFijianFilipinoFinnishFrenchFrench American IndianFrench CanadianGermanGerman RussianGhanaianGreekGuamanian/ChamorroGuatemalanGuyaneseHaitianHmongHonduranHopiHoumaHungarianIcelanderIndian (Asian)IndonesianInupiatIranianIraqiIrishIroquoisIsraeliItalianJamaicanJapaneseJordanianKenyanKiowaKoreanLaotianLatvianLebaneseLiberianLithuanianLumbeeLuxembourgerMacedonianMalaysianMalteseMarshalleseMenomineeMexicanMexican American IndianMongolianMoroccanNative HawaiianNavajoNepaleseNew ZealanderNicaraguanNigerianNorthern EuropeanNorwegianOkinawanOsageOttawaPaiutePakistaniPalestinianPanamanianParaguayanPennsylvania GermanPeruvianPimaPolishPortuguesePotawatomiPuebloPuerto RicanPuget Sound SalishRomanianRussianSalvadoranSamoanScandinavianScotch-IrishScottishSeminoleSenegaleseSerbianShoshoneSierra LeoneanSiouxSlavicSlovakSloveneSomaliSouth AfricanSouth AmericanSouth American IndianSoviet UnionSpaniardSpanishSpanish AmericanSpanish American IndianSri LankanSubsaharan AfricanSudaneseSwedishSwissSyrianTaiwaneseTlingit-HaidaTohono O'OdhamTonganTrinidadian and TobagonianTsimshianTurkishU.S. Virgin IslanderUgandanUkrainianUruguayanUteVenezuelanVietnameseWelshWest IndianYakamaYaquiYugoslavianYumanYup'ikZimbabwean
Immigration
NonimmigrantsImmigrantsAfghanistanAfricaAlbaniaArgentinaArmeniaAsiaAustraliaAustriaBahamasBangladeshBarbadosBelarusBelgiumBelizeBoliviaBosnia and HerzegovinaBrazilBulgariaBurma/MyanmarCabo VerdeCambodiaCameroonCanadaCaribbeanCentral AmericaChileChinaColombiaCongoCosta RicaCroatiaCubaCzechoslovakiaDenmarkDominicaDominican RepublicEastern AfricaEastern AsiaEastern EuropeEcuadorEgyptEl SalvadorEnglandEritreaEthiopiaEuropeFijiFranceGermanyGhanaGreeceGrenadaGuatemalaGuyanaHaitiHondurasHong KongHungaryIndiaIndonesiaIranIraqIrelandIsraelItalyJamaicaJapanJordanKazakhstanKenyaKoreaKuwaitLaosLatin AmericaLatviaLebanonLiberiaLithuaniaMalaysiaMexicoMicronesiaMiddle AfricaMoldovaMoroccoNepalNetherlandsNicaraguaNigeriaNorth AmericaNorth MacedoniaNorthern AfricaNorthern EuropeNorwayOceaniaPakistanPanamaPeruPhilippinesPolandPortugalRomaniaRussiaSaudi ArabiaScotlandSenegalSerbiaSierra LeoneSingaporeSomaliaSouth AfricaSouth AmericaSouth Central AsiaSouth Eastern AsiaSouthern EuropeSpainSri LankaSt. Vincent and the GrenadinesSudanSwedenSwitzerlandSyriaTaiwanThailandTrinidad and TobagoTurkeyUgandaUkraineUruguayUzbekistanVenezuelaVietnamWest IndiesWestern AfricaWestern AsiaWestern EuropeYemenZaireZimbabweAzores
Thai
Race
Ancestry
AfghanAfricanAlaska NativeAlaskan AthabascanAlbanianAleutAlsatianAmericanApacheArabArapahoArgentineanArmenianAssyrian/Chaldean/SyriacAustralianAustrianBahamianBangladeshiBarbadianBasqueBelgianBelizeanBermudanBhutaneseBlackfeetBolivianBrazilianBritishBritish West IndianBulgarianBurmeseCajunCambodianCanadianCape VerdeanCarpatho RusynCelticCentral AmericanCentral American IndianCherokeeCheyenneChickasawChileanChineseChippewaChoctawColombianColvilleComancheCosta RicanCreeCreekCroatianCrowCubanCypriotCzechCzechoslovakianDanishDelawareDominicanDutchDutch West IndianEastern EuropeanEcuadorianEgyptianEnglishEstonianEthiopianEuropeanFijianFilipinoFinnishFrenchFrench American IndianFrench CanadianGermanGerman RussianGhanaianGreekGuamanian/ChamorroGuatemalanGuyaneseHaitianHmongHonduranHopiHoumaHungarianIcelanderIndian (Asian)IndonesianInupiatIranianIraqiIrishIroquoisIsraeliItalianJamaicanJapaneseJordanianKenyanKiowaKoreanLaotianLatvianLebaneseLiberianLithuanianLumbeeLuxembourgerMacedonianMalaysianMalteseMarshalleseMenomineeMexicanMexican American IndianMongolianMoroccanNative HawaiianNavajoNepaleseNew ZealanderNicaraguanNigerianNorthern EuropeanNorwegianOkinawanOsageOttawaPaiutePakistaniPalestinianPanamanianParaguayanPennsylvania GermanPeruvianPimaPolishPortuguesePotawatomiPuebloPuerto RicanPuget Sound SalishRomanianRussianSalvadoranSamoanScandinavianScotch-IrishScottishSeminoleSenegaleseSerbianShoshoneSierra LeoneanSiouxSlavicSlovakSloveneSomaliSouth AfricanSouth AmericanSouth American IndianSoviet UnionSpaniardSpanishSpanish AmericanSpanish American IndianSri LankanSubsaharan AfricanSudaneseSwedishSwissSyrianTaiwaneseThaiTlingit-HaidaTohono O'OdhamTonganTrinidadian and TobagonianTsimshianTurkishU.S. Virgin IslanderUgandanUkrainianUruguayanUteVenezuelanVietnameseWelshWest IndianYakamaYaquiYugoslavianYumanYup'ikZimbabwean
Immigration
NonimmigrantsImmigrantsAfghanistanAfricaAlbaniaArgentinaArmeniaAsiaAustraliaAustriaBahamasBangladeshBarbadosBelarusBelgiumBelizeBoliviaBosnia and HerzegovinaBrazilBulgariaBurma/MyanmarCabo VerdeCambodiaCameroonCanadaCaribbeanCentral AmericaChileChinaColombiaCongoCosta RicaCroatiaCubaCzechoslovakiaDenmarkDominicaDominican RepublicEastern AfricaEastern AsiaEastern EuropeEcuadorEgyptEl SalvadorEnglandEritreaEthiopiaEuropeFijiFranceGermanyGhanaGreeceGrenadaGuatemalaGuyanaHaitiHondurasHong KongHungaryIndiaIndonesiaIranIraqIrelandIsraelItalyJamaicaJapanJordanKazakhstanKenyaKoreaKuwaitLaosLatin AmericaLatviaLebanonLiberiaLithuaniaMalaysiaMexicoMicronesiaMiddle AfricaMoldovaMoroccoNepalNetherlandsNicaraguaNigeriaNorth AmericaNorth MacedoniaNorthern AfricaNorthern EuropeNorwayOceaniaPakistanPanamaPhilippinesPolandPortugalRomaniaRussiaSaudi ArabiaScotlandSenegalSerbiaSierra LeoneSingaporeSomaliaSouth AfricaSouth AmericaSouth Central AsiaSouth Eastern AsiaSouthern EuropeSpainSri LankaSt. Vincent and the GrenadinesSudanSwedenSwitzerlandSyriaTaiwanThailandTrinidad and TobagoTurkeyUgandaUkraineUruguayUzbekistanVenezuelaVietnamWest IndiesWestern AfricaWestern AsiaWestern EuropeYemenZaireZimbabweAzores
Bachelor's Degree
Income
Poverty
Unemployment
Labor Participation
Family Structure
Vehicle Availability
Education Level
Disability

Bachelor's Degree Comparison

Immigrants from Peru

Thais

Average
Exceptional
37.5%
BACHELOR'S DEGREE
41.3/ 100
METRIC RATING
185th/ 347
METRIC RANK
50.1%
BACHELOR'S DEGREE
100.0/ 100
METRIC RATING
8th/ 347
METRIC RANK

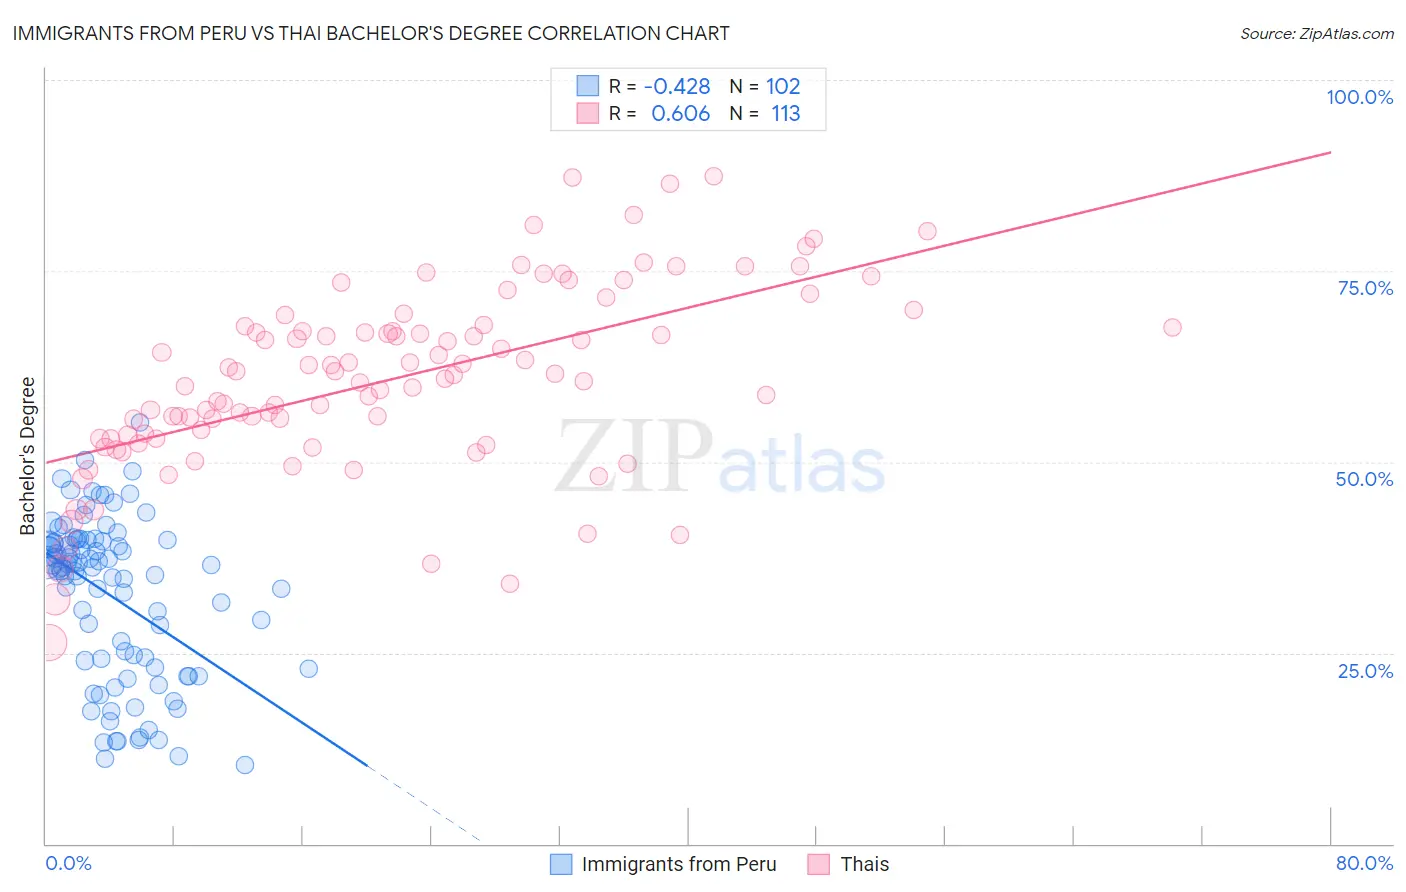
Immigrants from Peru vs Thai Bachelor's Degree Correlation Chart

The statistical analysis conducted on geographies consisting of 328,855,740 people shows a moderate negative correlation between the proportion of Immigrants from Peru and percentage of population with at least bachelor's degree education in the United States with a correlation coefficient (R) of -0.428 and weighted average of 37.5%. Similarly, the statistical analysis conducted on geographies consisting of 475,734,010 people shows a significant positive correlation between the proportion of Thais and percentage of population with at least bachelor's degree education in the United States with a correlation coefficient (R) of 0.606 and weighted average of 50.1%, a difference of 33.6%.
Immigrants from Peru vs Thai Bachelor's Degree

Bachelor's Degree Correlation Summary

MeasurementImmigrants from PeruThai
Minimum10.3%26.3%
Maximum55.2%87.4%
Range44.9%61.1%
Mean32.4%60.8%
Median36.1%61.3%
Interquartile 25% (IQ1)23.0%53.0%
Interquartile 75% (IQ3)39.5%67.7%
Interquartile Range (IQR)16.5%14.7%
Standard Deviation (Sample)10.6%12.0%
Standard Deviation (Population)10.5%12.0%

Similar Demographics by Bachelor's Degree

Demographics Similar to Immigrants from Peru by Bachelor's Degree

In terms of bachelor's degree, the demographic groups most similar to Immigrants from Peru are Scandinavian (37.5%, a difference of 0.040%), Senegalese (37.5%, a difference of 0.080%), Norwegian (37.5%, a difference of 0.10%), English (37.4%, a difference of 0.17%), and Immigrants from Bosnia and Herzegovina (37.6%, a difference of 0.21%).
DemographicsRating | RankBachelor's Degree
Immigrants | Cameroon
46.8
/100
|
#178
Average
37.7%
Immigrants | Colombia
45.4
/100
|
#179
Average
37.7%
Irish
44.3
/100
|
#180
Average
37.6%
Immigrants | Senegal
43.8
/100
|
#181
Average
37.6%
Immigrants | Bosnia and Herzegovina
43.4
/100
|
#182
Average
37.6%
Senegalese
42.2
/100
|
#183
Average
37.5%
Scandinavians
41.7
/100
|
#184
Average
37.5%
Immigrants | Peru
41.3
/100
|
#185
Average
37.5%
Norwegians
40.4
/100
|
#186
Average
37.5%
English
39.7
/100
|
#187
Fair
37.4%
Immigrants | Oceania
37.3
/100
|
#188
Fair
37.3%
Slovaks
36.9
/100
|
#189
Fair
37.3%
Swiss
34.1
/100
|
#190
Fair
37.2%
Nigerians
33.9
/100
|
#191
Fair
37.2%
Immigrants | Vietnam
32.1
/100
|
#192
Fair
37.1%

Demographics Similar to Thais by Bachelor's Degree

In terms of bachelor's degree, the demographic groups most similar to Thais are Immigrants from Israel (50.0%, a difference of 0.24%), Immigrants from Iran (50.3%, a difference of 0.37%), Okinawan (50.5%, a difference of 0.85%), Iranian (51.0%, a difference of 1.7%), and Immigrants from Taiwan (51.2%, a difference of 2.1%).
DemographicsRating | RankBachelor's Degree
Filipinos
100.0
/100
|
#1
Exceptional
52.7%
Immigrants | Singapore
100.0
/100
|
#2
Exceptional
51.9%
Immigrants | India
100.0
/100
|
#3
Exceptional
51.3%
Immigrants | Taiwan
100.0
/100
|
#4
Exceptional
51.2%
Iranians
100.0
/100
|
#5
Exceptional
51.0%
Okinawans
100.0
/100
|
#6
Exceptional
50.5%
Immigrants | Iran
100.0
/100
|
#7
Exceptional
50.3%
Thais
100.0
/100
|
#8
Exceptional
50.1%
Immigrants | Israel
100.0
/100
|
#9
Exceptional
50.0%
Cypriots
100.0
/100
|
#10
Exceptional
49.0%
Immigrants | Australia
100.0
/100
|
#11
Exceptional
48.5%
Immigrants | China
100.0
/100
|
#12
Exceptional
48.4%
Immigrants | South Central Asia
100.0
/100
|
#13
Exceptional
48.3%
Immigrants | Hong Kong
100.0
/100
|
#14
Exceptional
48.2%
Immigrants | Eastern Asia
100.0
/100
|
#15
Exceptional
48.1%