Immigrants from Peru vs Osage 7th Grade

COMPARE

Immigrants from Peru
Race
Ancestry
AfghanAfricanAlaska NativeAlaskan AthabascanAlbanianAleutAlsatianAmericanApacheArabArapahoArgentineanArmenianAssyrian/Chaldean/SyriacAustralianAustrianBahamianBangladeshiBarbadianBasqueBelgianBelizeanBermudanBhutaneseBlackfeetBolivianBrazilianBritishBritish West IndianBulgarianBurmeseCajunCambodianCanadianCape VerdeanCarpatho RusynCelticCentral AmericanCentral American IndianCherokeeCheyenneChickasawChileanChineseChippewaChoctawColombianColvilleComancheCosta RicanCreeCreekCroatianCrowCubanCypriotCzechCzechoslovakianDanishDelawareDominicanDutchDutch West IndianEastern EuropeanEcuadorianEgyptianEnglishEstonianEthiopianEuropeanFijianFilipinoFinnishFrenchFrench American IndianFrench CanadianGermanGerman RussianGhanaianGreekGuamanian/ChamorroGuatemalanGuyaneseHaitianHmongHonduranHopiHoumaHungarianIcelanderIndian (Asian)IndonesianInupiatIranianIraqiIrishIroquoisIsraeliItalianJamaicanJapaneseJordanianKenyanKiowaKoreanLaotianLatvianLebaneseLiberianLithuanianLumbeeLuxembourgerMacedonianMalaysianMalteseMarshalleseMenomineeMexicanMexican American IndianMongolianMoroccanNative HawaiianNavajoNepaleseNew ZealanderNicaraguanNigerianNorthern EuropeanNorwegianOkinawanOttawaPaiutePakistaniPalestinianPanamanianParaguayanPennsylvania GermanPeruvianPimaPolishPortuguesePotawatomiPuebloPuerto RicanPuget Sound SalishRomanianRussianSalvadoranSamoanScandinavianScotch-IrishScottishSeminoleSenegaleseSerbianShoshoneSierra LeoneanSiouxSlavicSlovakSloveneSomaliSouth AfricanSouth AmericanSouth American IndianSoviet UnionSpaniardSpanishSpanish AmericanSpanish American IndianSri LankanSubsaharan AfricanSudaneseSwedishSwissSyrianTaiwaneseThaiTlingit-HaidaTohono O'OdhamTonganTrinidadian and TobagonianTsimshianTurkishU.S. Virgin IslanderUgandanUkrainianUruguayanUteVenezuelanVietnameseWelshWest IndianYakamaYaquiYugoslavianYumanYup'ikZimbabwean
Immigration
NonimmigrantsImmigrantsAfghanistanAfricaAlbaniaArgentinaArmeniaAsiaAustraliaAustriaBahamasBangladeshBarbadosBelarusBelgiumBelizeBoliviaBosnia and HerzegovinaBrazilBulgariaBurma/MyanmarCabo VerdeCambodiaCameroonCanadaCaribbeanCentral AmericaChileChinaColombiaCongoCosta RicaCroatiaCubaCzechoslovakiaDenmarkDominicaDominican RepublicEastern AfricaEastern AsiaEastern EuropeEcuadorEgyptEl SalvadorEnglandEritreaEthiopiaEuropeFijiFranceGermanyGhanaGreeceGrenadaGuatemalaGuyanaHaitiHondurasHong KongHungaryIndiaIndonesiaIranIraqIrelandIsraelItalyJamaicaJapanJordanKazakhstanKenyaKoreaKuwaitLaosLatin AmericaLatviaLebanonLiberiaLithuaniaMalaysiaMexicoMicronesiaMiddle AfricaMoldovaMoroccoNepalNetherlandsNicaraguaNigeriaNorth AmericaNorth MacedoniaNorthern AfricaNorthern EuropeNorwayOceaniaPakistanPanamaPeruPhilippinesPolandPortugalRomaniaRussiaSaudi ArabiaScotlandSenegalSerbiaSierra LeoneSingaporeSomaliaSouth AfricaSouth AmericaSouth Central AsiaSouth Eastern AsiaSouthern EuropeSpainSri LankaSt. Vincent and the GrenadinesSudanSwedenSwitzerlandSyriaTaiwanThailandTrinidad and TobagoTurkeyUgandaUkraineUruguayUzbekistanVenezuelaVietnamWest IndiesWestern AfricaWestern AsiaWestern EuropeYemenZaireZimbabweAzores
Osage
Race
Ancestry
AfghanAfricanAlaska NativeAlaskan AthabascanAlbanianAleutAlsatianAmericanApacheArabArapahoArgentineanArmenianAssyrian/Chaldean/SyriacAustralianAustrianBahamianBangladeshiBarbadianBasqueBelgianBelizeanBermudanBhutaneseBlackfeetBolivianBrazilianBritishBritish West IndianBulgarianBurmeseCajunCambodianCanadianCape VerdeanCarpatho RusynCelticCentral AmericanCentral American IndianCherokeeCheyenneChickasawChileanChineseChippewaChoctawColombianColvilleComancheCosta RicanCreeCreekCroatianCrowCubanCypriotCzechCzechoslovakianDanishDelawareDominicanDutchDutch West IndianEastern EuropeanEcuadorianEgyptianEnglishEstonianEthiopianEuropeanFijianFilipinoFinnishFrenchFrench American IndianFrench CanadianGermanGerman RussianGhanaianGreekGuamanian/ChamorroGuatemalanGuyaneseHaitianHmongHonduranHopiHoumaHungarianIcelanderIndian (Asian)IndonesianInupiatIranianIraqiIrishIroquoisIsraeliItalianJamaicanJapaneseJordanianKenyanKiowaKoreanLaotianLatvianLebaneseLiberianLithuanianLumbeeLuxembourgerMacedonianMalaysianMalteseMarshalleseMenomineeMexicanMexican American IndianMongolianMoroccanNative HawaiianNavajoNepaleseNew ZealanderNicaraguanNigerianNorthern EuropeanNorwegianOkinawanOsageOttawaPaiutePakistaniPalestinianPanamanianParaguayanPennsylvania GermanPeruvianPimaPolishPortuguesePotawatomiPuebloPuerto RicanPuget Sound SalishRomanianRussianSalvadoranSamoanScandinavianScotch-IrishScottishSeminoleSenegaleseSerbianShoshoneSierra LeoneanSiouxSlavicSlovakSloveneSomaliSouth AfricanSouth AmericanSouth American IndianSoviet UnionSpaniardSpanishSpanish AmericanSpanish American IndianSri LankanSubsaharan AfricanSudaneseSwedishSwissSyrianTaiwaneseThaiTlingit-HaidaTohono O'OdhamTonganTrinidadian and TobagonianTsimshianTurkishU.S. Virgin IslanderUgandanUkrainianUruguayanUteVenezuelanVietnameseWelshWest IndianYakamaYaquiYugoslavianYumanYup'ikZimbabwean
Immigration
NonimmigrantsImmigrantsAfghanistanAfricaAlbaniaArgentinaArmeniaAsiaAustraliaAustriaBahamasBangladeshBarbadosBelarusBelgiumBelizeBoliviaBosnia and HerzegovinaBrazilBulgariaBurma/MyanmarCabo VerdeCambodiaCameroonCanadaCaribbeanCentral AmericaChileChinaColombiaCongoCosta RicaCroatiaCubaCzechoslovakiaDenmarkDominicaDominican RepublicEastern AfricaEastern AsiaEastern EuropeEcuadorEgyptEl SalvadorEnglandEritreaEthiopiaEuropeFijiFranceGermanyGhanaGreeceGrenadaGuatemalaGuyanaHaitiHondurasHong KongHungaryIndiaIndonesiaIranIraqIrelandIsraelItalyJamaicaJapanJordanKazakhstanKenyaKoreaKuwaitLaosLatin AmericaLatviaLebanonLiberiaLithuaniaMalaysiaMexicoMicronesiaMiddle AfricaMoldovaMoroccoNepalNetherlandsNicaraguaNigeriaNorth AmericaNorth MacedoniaNorthern AfricaNorthern EuropeNorwayOceaniaPakistanPanamaPhilippinesPolandPortugalRomaniaRussiaSaudi ArabiaScotlandSenegalSerbiaSierra LeoneSingaporeSomaliaSouth AfricaSouth AmericaSouth Central AsiaSouth Eastern AsiaSouthern EuropeSpainSri LankaSt. Vincent and the GrenadinesSudanSwedenSwitzerlandSyriaTaiwanThailandTrinidad and TobagoTurkeyUgandaUkraineUruguayUzbekistanVenezuelaVietnamWest IndiesWestern AfricaWestern AsiaWestern EuropeYemenZaireZimbabweAzores
7th Grade
Income
Poverty
Unemployment
Labor Participation
Family Structure
Vehicle Availability
Education Level
Disability

7th Grade Comparison

Immigrants from Peru

Osage

Tragic
Exceptional
94.9%
7TH GRADE
0.0/ 100
METRIC RATING
287th/ 347
METRIC RANK
96.7%
7TH GRADE
98.9/ 100
METRIC RATING
91st/ 347
METRIC RANK

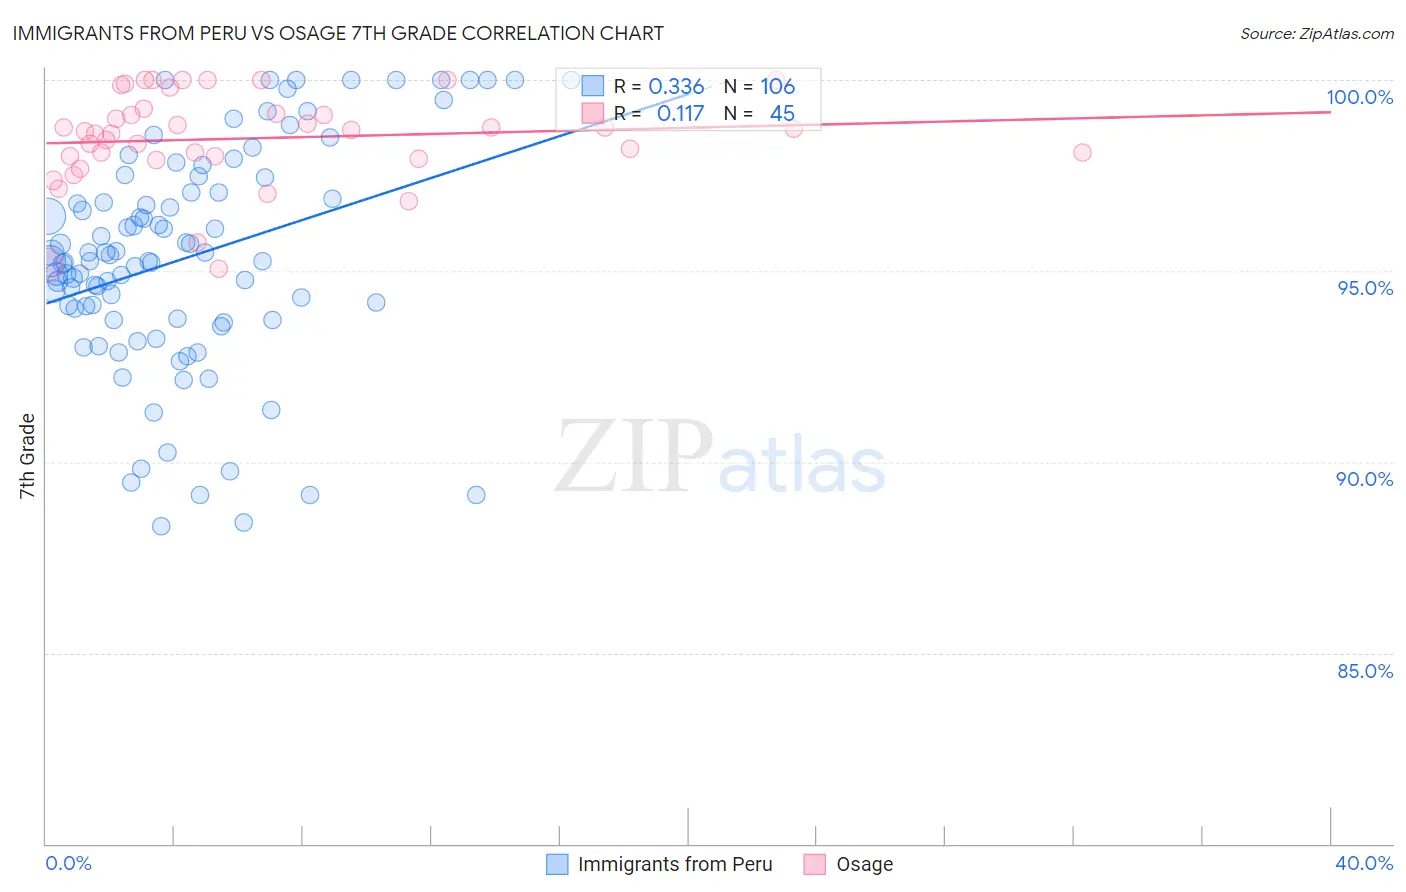
Immigrants from Peru vs Osage 7th Grade Correlation Chart

The statistical analysis conducted on geographies consisting of 328,685,851 people shows a mild positive correlation between the proportion of Immigrants from Peru and percentage of population with at least 7th grade education in the United States with a correlation coefficient (R) of 0.336 and weighted average of 94.9%. Similarly, the statistical analysis conducted on geographies consisting of 91,808,929 people shows a poor positive correlation between the proportion of Osage and percentage of population with at least 7th grade education in the United States with a correlation coefficient (R) of 0.117 and weighted average of 96.7%, a difference of 1.9%.
Immigrants from Peru vs Osage 7th Grade

7th Grade Correlation Summary

MeasurementImmigrants from PeruOsage
Minimum88.3%95.1%
Maximum100.0%100.0%
Range11.7%4.9%
Mean95.4%98.5%
Median95.3%98.7%
Interquartile 25% (IQ1)93.7%98.0%
Interquartile 75% (IQ3)97.1%99.2%
Interquartile Range (IQR)3.3%1.2%
Standard Deviation (Sample)2.9%1.2%
Standard Deviation (Population)2.9%1.2%

Similar Demographics by 7th Grade

Demographics Similar to Immigrants from Peru by 7th Grade

In terms of 7th grade, the demographic groups most similar to Immigrants from Peru are Immigrants from Philippines (94.9%, a difference of 0.010%), British West Indian (94.8%, a difference of 0.020%), Taiwanese (94.8%, a difference of 0.030%), Malaysian (94.8%, a difference of 0.050%), and Armenian (95.0%, a difference of 0.090%).
DemographicsRating | Rank7th Grade
Immigrants | St. Vincent and the Grenadines
0.1
/100
|
#280
Tragic
95.0%
Tohono O'odham
0.1
/100
|
#281
Tragic
95.0%
Immigrants | Bolivia
0.1
/100
|
#282
Tragic
95.0%
Immigrants | Barbados
0.1
/100
|
#283
Tragic
95.0%
Armenians
0.1
/100
|
#284
Tragic
95.0%
Immigrants | Eritrea
0.1
/100
|
#285
Tragic
94.9%
Immigrants | Philippines
0.0
/100
|
#286
Tragic
94.9%
Immigrants | Peru
0.0
/100
|
#287
Tragic
94.9%
British West Indians
0.0
/100
|
#288
Tragic
94.8%
Taiwanese
0.0
/100
|
#289
Tragic
94.8%
Malaysians
0.0
/100
|
#290
Tragic
94.8%
Immigrants | Grenada
0.0
/100
|
#291
Tragic
94.8%
Immigrants | West Indies
0.0
/100
|
#292
Tragic
94.8%
Fijians
0.0
/100
|
#293
Tragic
94.7%
Haitians
0.0
/100
|
#294
Tragic
94.7%

Demographics Similar to Osage by 7th Grade

In terms of 7th grade, the demographic groups most similar to Osage are Immigrants from South Africa (96.7%, a difference of 0.0%), Immigrants from Western Europe (96.7%, a difference of 0.0%), Potawatomi (96.7%, a difference of 0.0%), Immigrants from Belgium (96.7%, a difference of 0.010%), and Puget Sound Salish (96.7%, a difference of 0.010%).
DemographicsRating | Rank7th Grade
Romanians
99.1
/100
|
#84
Exceptional
96.7%
Kiowa
99.1
/100
|
#85
Exceptional
96.7%
Turks
99.1
/100
|
#86
Exceptional
96.7%
Immigrants | Belgium
99.0
/100
|
#87
Exceptional
96.7%
Puget Sound Salish
99.0
/100
|
#88
Exceptional
96.7%
Cree
99.0
/100
|
#89
Exceptional
96.7%
Immigrants | South Africa
98.9
/100
|
#90
Exceptional
96.7%
Osage
98.9
/100
|
#91
Exceptional
96.7%
Immigrants | Western Europe
98.9
/100
|
#92
Exceptional
96.7%
Potawatomi
98.9
/100
|
#93
Exceptional
96.7%
Lebanese
98.8
/100
|
#94
Exceptional
96.7%
Immigrants | Australia
98.8
/100
|
#95
Exceptional
96.7%
Immigrants | Denmark
98.7
/100
|
#96
Exceptional
96.7%
Immigrants | Germany
98.7
/100
|
#97
Exceptional
96.7%
Immigrants | Sweden
98.7
/100
|
#98
Exceptional
96.7%