Immigrants from Peru vs Marshallese 6th Grade

COMPARE

Immigrants from Peru
Race
Ancestry
AfghanAfricanAlaska NativeAlaskan AthabascanAlbanianAleutAlsatianAmericanApacheArabArapahoArgentineanArmenianAssyrian/Chaldean/SyriacAustralianAustrianBahamianBangladeshiBarbadianBasqueBelgianBelizeanBermudanBhutaneseBlackfeetBolivianBrazilianBritishBritish West IndianBulgarianBurmeseCajunCambodianCanadianCape VerdeanCarpatho RusynCelticCentral AmericanCentral American IndianCherokeeCheyenneChickasawChileanChineseChippewaChoctawColombianColvilleComancheCosta RicanCreeCreekCroatianCrowCubanCypriotCzechCzechoslovakianDanishDelawareDominicanDutchDutch West IndianEastern EuropeanEcuadorianEgyptianEnglishEstonianEthiopianEuropeanFijianFilipinoFinnishFrenchFrench American IndianFrench CanadianGermanGerman RussianGhanaianGreekGuamanian/ChamorroGuatemalanGuyaneseHaitianHmongHonduranHopiHoumaHungarianIcelanderIndian (Asian)IndonesianInupiatIranianIraqiIrishIroquoisIsraeliItalianJamaicanJapaneseJordanianKenyanKiowaKoreanLaotianLatvianLebaneseLiberianLithuanianLumbeeLuxembourgerMacedonianMalaysianMalteseMenomineeMexicanMexican American IndianMongolianMoroccanNative HawaiianNavajoNepaleseNew ZealanderNicaraguanNigerianNorthern EuropeanNorwegianOkinawanOsageOttawaPaiutePakistaniPalestinianPanamanianParaguayanPennsylvania GermanPeruvianPimaPolishPortuguesePotawatomiPuebloPuerto RicanPuget Sound SalishRomanianRussianSalvadoranSamoanScandinavianScotch-IrishScottishSeminoleSenegaleseSerbianShoshoneSierra LeoneanSiouxSlavicSlovakSloveneSomaliSouth AfricanSouth AmericanSouth American IndianSoviet UnionSpaniardSpanishSpanish AmericanSpanish American IndianSri LankanSubsaharan AfricanSudaneseSwedishSwissSyrianTaiwaneseThaiTlingit-HaidaTohono O'OdhamTonganTrinidadian and TobagonianTsimshianTurkishU.S. Virgin IslanderUgandanUkrainianUruguayanUteVenezuelanVietnameseWelshWest IndianYakamaYaquiYugoslavianYumanYup'ikZimbabwean
Immigration
NonimmigrantsImmigrantsAfghanistanAfricaAlbaniaArgentinaArmeniaAsiaAustraliaAustriaBahamasBangladeshBarbadosBelarusBelgiumBelizeBoliviaBosnia and HerzegovinaBrazilBulgariaBurma/MyanmarCabo VerdeCambodiaCameroonCanadaCaribbeanCentral AmericaChileChinaColombiaCongoCosta RicaCroatiaCubaCzechoslovakiaDenmarkDominicaDominican RepublicEastern AfricaEastern AsiaEastern EuropeEcuadorEgyptEl SalvadorEnglandEritreaEthiopiaEuropeFijiFranceGermanyGhanaGreeceGrenadaGuatemalaGuyanaHaitiHondurasHong KongHungaryIndiaIndonesiaIranIraqIrelandIsraelItalyJamaicaJapanJordanKazakhstanKenyaKoreaKuwaitLaosLatin AmericaLatviaLebanonLiberiaLithuaniaMalaysiaMexicoMicronesiaMiddle AfricaMoldovaMoroccoNepalNetherlandsNicaraguaNigeriaNorth AmericaNorth MacedoniaNorthern AfricaNorthern EuropeNorwayOceaniaPakistanPanamaPeruPhilippinesPolandPortugalRomaniaRussiaSaudi ArabiaScotlandSenegalSerbiaSierra LeoneSingaporeSomaliaSouth AfricaSouth AmericaSouth Central AsiaSouth Eastern AsiaSouthern EuropeSpainSri LankaSt. Vincent and the GrenadinesSudanSwedenSwitzerlandSyriaTaiwanThailandTrinidad and TobagoTurkeyUgandaUkraineUruguayUzbekistanVenezuelaVietnamWest IndiesWestern AfricaWestern AsiaWestern EuropeYemenZaireZimbabweAzores
Marshallese
Race
Ancestry
AfghanAfricanAlaska NativeAlaskan AthabascanAlbanianAleutAlsatianAmericanApacheArabArapahoArgentineanArmenianAssyrian/Chaldean/SyriacAustralianAustrianBahamianBangladeshiBarbadianBasqueBelgianBelizeanBermudanBhutaneseBlackfeetBolivianBrazilianBritishBritish West IndianBulgarianBurmeseCajunCambodianCanadianCape VerdeanCarpatho RusynCelticCentral AmericanCentral American IndianCherokeeCheyenneChickasawChileanChineseChippewaChoctawColombianColvilleComancheCosta RicanCreeCreekCroatianCrowCubanCypriotCzechCzechoslovakianDanishDelawareDominicanDutchDutch West IndianEastern EuropeanEcuadorianEgyptianEnglishEstonianEthiopianEuropeanFijianFilipinoFinnishFrenchFrench American IndianFrench CanadianGermanGerman RussianGhanaianGreekGuamanian/ChamorroGuatemalanGuyaneseHaitianHmongHonduranHopiHoumaHungarianIcelanderIndian (Asian)IndonesianInupiatIranianIraqiIrishIroquoisIsraeliItalianJamaicanJapaneseJordanianKenyanKiowaKoreanLaotianLatvianLebaneseLiberianLithuanianLumbeeLuxembourgerMacedonianMalaysianMalteseMarshalleseMenomineeMexicanMexican American IndianMongolianMoroccanNative HawaiianNavajoNepaleseNew ZealanderNicaraguanNigerianNorthern EuropeanNorwegianOkinawanOsageOttawaPaiutePakistaniPalestinianPanamanianParaguayanPennsylvania GermanPeruvianPimaPolishPortuguesePotawatomiPuebloPuerto RicanPuget Sound SalishRomanianRussianSalvadoranSamoanScandinavianScotch-IrishScottishSeminoleSenegaleseSerbianShoshoneSierra LeoneanSiouxSlavicSlovakSloveneSomaliSouth AfricanSouth AmericanSouth American IndianSoviet UnionSpaniardSpanishSpanish AmericanSpanish American IndianSri LankanSubsaharan AfricanSudaneseSwedishSwissSyrianTaiwaneseThaiTlingit-HaidaTohono O'OdhamTonganTrinidadian and TobagonianTsimshianTurkishU.S. Virgin IslanderUgandanUkrainianUruguayanUteVenezuelanVietnameseWelshWest IndianYakamaYaquiYugoslavianYumanYup'ikZimbabwean
Immigration
NonimmigrantsImmigrantsAfghanistanAfricaAlbaniaArgentinaArmeniaAsiaAustraliaAustriaBahamasBangladeshBarbadosBelarusBelgiumBelizeBoliviaBosnia and HerzegovinaBrazilBulgariaBurma/MyanmarCabo VerdeCambodiaCameroonCanadaCaribbeanCentral AmericaChileChinaColombiaCongoCosta RicaCroatiaCubaCzechoslovakiaDenmarkDominicaDominican RepublicEastern AfricaEastern AsiaEastern EuropeEcuadorEgyptEl SalvadorEnglandEritreaEthiopiaEuropeFijiFranceGermanyGhanaGreeceGrenadaGuatemalaGuyanaHaitiHondurasHong KongHungaryIndiaIndonesiaIranIraqIrelandIsraelItalyJamaicaJapanJordanKazakhstanKenyaKoreaKuwaitLaosLatin AmericaLatviaLebanonLiberiaLithuaniaMalaysiaMexicoMicronesiaMiddle AfricaMoldovaMoroccoNepalNetherlandsNicaraguaNigeriaNorth AmericaNorth MacedoniaNorthern AfricaNorthern EuropeNorwayOceaniaPakistanPanamaPhilippinesPolandPortugalRomaniaRussiaSaudi ArabiaScotlandSenegalSerbiaSierra LeoneSingaporeSomaliaSouth AfricaSouth AmericaSouth Central AsiaSouth Eastern AsiaSouthern EuropeSpainSri LankaSt. Vincent and the GrenadinesSudanSwedenSwitzerlandSyriaTaiwanThailandTrinidad and TobagoTurkeyUgandaUkraineUruguayUzbekistanVenezuelaVietnamWest IndiesWestern AfricaWestern AsiaWestern EuropeYemenZaireZimbabweAzores
6th Grade
Income
Poverty
Unemployment
Labor Participation
Family Structure
Vehicle Availability
Education Level
Disability

6th Grade Comparison

Immigrants from Peru

Marshallese

Tragic
Good
96.2%
6TH GRADE
0.1/ 100
METRIC RATING
279th/ 347
METRIC RANK
97.1%
6TH GRADE
60.2/ 100
METRIC RATING
162nd/ 347
METRIC RANK

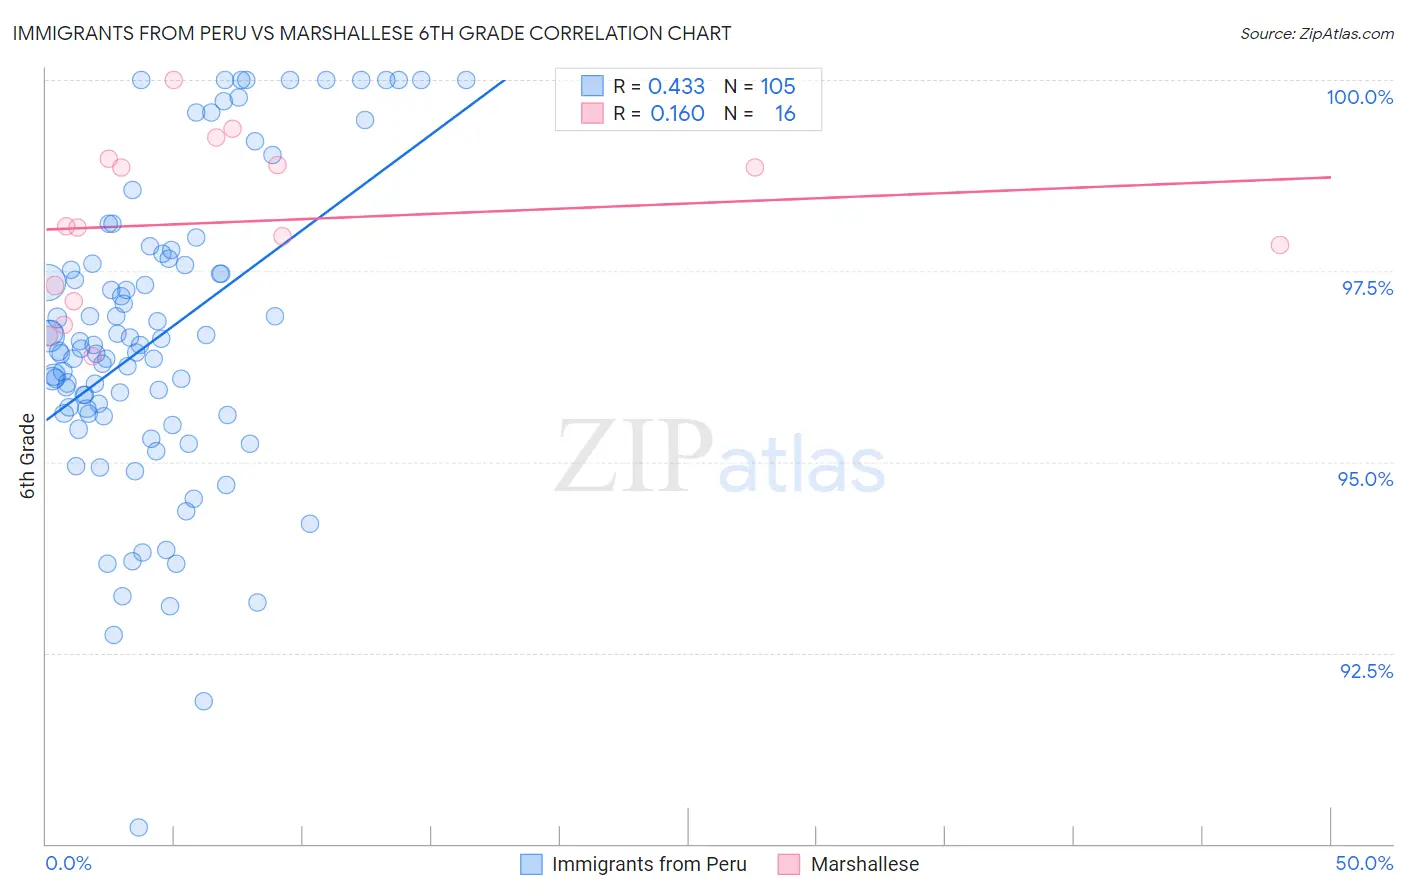
Immigrants from Peru vs Marshallese 6th Grade Correlation Chart

The statistical analysis conducted on geographies consisting of 328,685,754 people shows a moderate positive correlation between the proportion of Immigrants from Peru and percentage of population with at least 6th grade education in the United States with a correlation coefficient (R) of 0.433 and weighted average of 96.2%. Similarly, the statistical analysis conducted on geographies consisting of 14,761,315 people shows a poor positive correlation between the proportion of Marshallese and percentage of population with at least 6th grade education in the United States with a correlation coefficient (R) of 0.160 and weighted average of 97.1%, a difference of 0.88%.
Immigrants from Peru vs Marshallese 6th Grade

6th Grade Correlation Summary

MeasurementImmigrants from PeruMarshallese
Minimum90.2%96.4%
Maximum100.0%100.0%
Range9.8%3.6%
Mean96.6%98.1%
Median96.5%98.1%
Interquartile 25% (IQ1)95.6%97.2%
Interquartile 75% (IQ3)97.6%98.9%
Interquartile Range (IQR)2.0%1.7%
Standard Deviation (Sample)2.0%1.1%
Standard Deviation (Population)2.0%1.0%

Similar Demographics by 6th Grade

Demographics Similar to Immigrants from Peru by 6th Grade

In terms of 6th grade, the demographic groups most similar to Immigrants from Peru are Immigrants from Afghanistan (96.2%, a difference of 0.0%), Trinidadian and Tobagonian (96.2%, a difference of 0.0%), Houma (96.2%, a difference of 0.0%), Immigrants from Thailand (96.3%, a difference of 0.010%), and Yaqui (96.3%, a difference of 0.020%).
DemographicsRating | Rank6th Grade
Immigrants | Bolivia
0.1
/100
|
#272
Tragic
96.3%
Immigrants | Cameroon
0.1
/100
|
#273
Tragic
96.3%
Immigrants | Philippines
0.1
/100
|
#274
Tragic
96.3%
Immigrants | Ghana
0.1
/100
|
#275
Tragic
96.3%
Yaqui
0.1
/100
|
#276
Tragic
96.3%
Immigrants | Western Africa
0.1
/100
|
#277
Tragic
96.3%
Immigrants | Thailand
0.1
/100
|
#278
Tragic
96.3%
Immigrants | Peru
0.1
/100
|
#279
Tragic
96.2%
Immigrants | Afghanistan
0.1
/100
|
#280
Tragic
96.2%
Trinidadians and Tobagonians
0.1
/100
|
#281
Tragic
96.2%
Houma
0.1
/100
|
#282
Tragic
96.2%
Cubans
0.1
/100
|
#283
Tragic
96.2%
Fijians
0.1
/100
|
#284
Tragic
96.2%
Somalis
0.1
/100
|
#285
Tragic
96.2%
Barbadians
0.0
/100
|
#286
Tragic
96.2%

Demographics Similar to Marshallese by 6th Grade

In terms of 6th grade, the demographic groups most similar to Marshallese are Immigrants from Belarus (97.1%, a difference of 0.0%), Immigrants from Iran (97.1%, a difference of 0.010%), Kenyan (97.1%, a difference of 0.010%), Ugandan (97.1%, a difference of 0.010%), and Albanian (97.1%, a difference of 0.010%).
DemographicsRating | Rank6th Grade
Ute
71.1
/100
|
#155
Good
97.1%
Alsatians
69.8
/100
|
#156
Good
97.1%
Immigrants | Russia
67.6
/100
|
#157
Good
97.1%
Immigrants | Iran
63.3
/100
|
#158
Good
97.1%
Kenyans
62.9
/100
|
#159
Good
97.1%
Ugandans
62.2
/100
|
#160
Good
97.1%
Immigrants | Belarus
60.4
/100
|
#161
Good
97.1%
Marshallese
60.2
/100
|
#162
Good
97.1%
Albanians
57.8
/100
|
#163
Average
97.1%
Immigrants | Korea
57.7
/100
|
#164
Average
97.1%
Immigrants | Poland
56.2
/100
|
#165
Average
97.1%
Immigrants | Italy
53.8
/100
|
#166
Average
97.1%
Apache
53.6
/100
|
#167
Average
97.1%
Immigrants | Taiwan
53.5
/100
|
#168
Average
97.1%
Bermudans
52.6
/100
|
#169
Average
97.1%