Immigrants from Peru vs Jordanian 12th Grade, No Diploma

COMPARE

Immigrants from Peru
Race
Ancestry
AfghanAfricanAlaska NativeAlaskan AthabascanAlbanianAleutAlsatianAmericanApacheArabArapahoArgentineanArmenianAssyrian/Chaldean/SyriacAustralianAustrianBahamianBangladeshiBarbadianBasqueBelgianBelizeanBermudanBhutaneseBlackfeetBolivianBrazilianBritishBritish West IndianBulgarianBurmeseCajunCambodianCanadianCape VerdeanCarpatho RusynCelticCentral AmericanCentral American IndianCherokeeCheyenneChickasawChileanChineseChippewaChoctawColombianColvilleComancheCosta RicanCreeCreekCroatianCrowCubanCypriotCzechCzechoslovakianDanishDelawareDominicanDutchDutch West IndianEastern EuropeanEcuadorianEgyptianEnglishEstonianEthiopianEuropeanFijianFilipinoFinnishFrenchFrench American IndianFrench CanadianGermanGerman RussianGhanaianGreekGuamanian/ChamorroGuatemalanGuyaneseHaitianHmongHonduranHopiHoumaHungarianIcelanderIndian (Asian)IndonesianInupiatIranianIraqiIrishIroquoisIsraeliItalianJamaicanJapaneseKenyanKiowaKoreanLaotianLatvianLebaneseLiberianLithuanianLumbeeLuxembourgerMacedonianMalaysianMalteseMarshalleseMenomineeMexicanMexican American IndianMongolianMoroccanNative HawaiianNavajoNepaleseNew ZealanderNicaraguanNigerianNorthern EuropeanNorwegianOkinawanOsageOttawaPaiutePakistaniPalestinianPanamanianParaguayanPennsylvania GermanPeruvianPimaPolishPortuguesePotawatomiPuebloPuerto RicanPuget Sound SalishRomanianRussianSalvadoranSamoanScandinavianScotch-IrishScottishSeminoleSenegaleseSerbianShoshoneSierra LeoneanSiouxSlavicSlovakSloveneSomaliSouth AfricanSouth AmericanSouth American IndianSoviet UnionSpaniardSpanishSpanish AmericanSpanish American IndianSri LankanSubsaharan AfricanSudaneseSwedishSwissSyrianTaiwaneseThaiTlingit-HaidaTohono O'OdhamTonganTrinidadian and TobagonianTsimshianTurkishU.S. Virgin IslanderUgandanUkrainianUruguayanUteVenezuelanVietnameseWelshWest IndianYakamaYaquiYugoslavianYumanYup'ikZimbabwean
Immigration
NonimmigrantsImmigrantsAfghanistanAfricaAlbaniaArgentinaArmeniaAsiaAustraliaAustriaBahamasBangladeshBarbadosBelarusBelgiumBelizeBoliviaBosnia and HerzegovinaBrazilBulgariaBurma/MyanmarCabo VerdeCambodiaCameroonCanadaCaribbeanCentral AmericaChileChinaColombiaCongoCosta RicaCroatiaCubaCzechoslovakiaDenmarkDominicaDominican RepublicEastern AfricaEastern AsiaEastern EuropeEcuadorEgyptEl SalvadorEnglandEritreaEthiopiaEuropeFijiFranceGermanyGhanaGreeceGrenadaGuatemalaGuyanaHaitiHondurasHong KongHungaryIndiaIndonesiaIranIraqIrelandIsraelItalyJamaicaJapanJordanKazakhstanKenyaKoreaKuwaitLaosLatin AmericaLatviaLebanonLiberiaLithuaniaMalaysiaMexicoMicronesiaMiddle AfricaMoldovaMoroccoNepalNetherlandsNicaraguaNigeriaNorth AmericaNorth MacedoniaNorthern AfricaNorthern EuropeNorwayOceaniaPakistanPanamaPeruPhilippinesPolandPortugalRomaniaRussiaSaudi ArabiaScotlandSenegalSerbiaSierra LeoneSingaporeSomaliaSouth AfricaSouth AmericaSouth Central AsiaSouth Eastern AsiaSouthern EuropeSpainSri LankaSt. Vincent and the GrenadinesSudanSwedenSwitzerlandSyriaTaiwanThailandTrinidad and TobagoTurkeyUgandaUkraineUruguayUzbekistanVenezuelaVietnamWest IndiesWestern AfricaWestern AsiaWestern EuropeYemenZaireZimbabweAzores
Jordanian
Race
Ancestry
AfghanAfricanAlaska NativeAlaskan AthabascanAlbanianAleutAlsatianAmericanApacheArabArapahoArgentineanArmenianAssyrian/Chaldean/SyriacAustralianAustrianBahamianBangladeshiBarbadianBasqueBelgianBelizeanBermudanBhutaneseBlackfeetBolivianBrazilianBritishBritish West IndianBulgarianBurmeseCajunCambodianCanadianCape VerdeanCarpatho RusynCelticCentral AmericanCentral American IndianCherokeeCheyenneChickasawChileanChineseChippewaChoctawColombianColvilleComancheCosta RicanCreeCreekCroatianCrowCubanCypriotCzechCzechoslovakianDanishDelawareDominicanDutchDutch West IndianEastern EuropeanEcuadorianEgyptianEnglishEstonianEthiopianEuropeanFijianFilipinoFinnishFrenchFrench American IndianFrench CanadianGermanGerman RussianGhanaianGreekGuamanian/ChamorroGuatemalanGuyaneseHaitianHmongHonduranHopiHoumaHungarianIcelanderIndian (Asian)IndonesianInupiatIranianIraqiIrishIroquoisIsraeliItalianJamaicanJapaneseJordanianKenyanKiowaKoreanLaotianLatvianLebaneseLiberianLithuanianLumbeeLuxembourgerMacedonianMalaysianMalteseMarshalleseMenomineeMexicanMexican American IndianMongolianMoroccanNative HawaiianNavajoNepaleseNew ZealanderNicaraguanNigerianNorthern EuropeanNorwegianOkinawanOsageOttawaPaiutePakistaniPalestinianPanamanianParaguayanPennsylvania GermanPeruvianPimaPolishPortuguesePotawatomiPuebloPuerto RicanPuget Sound SalishRomanianRussianSalvadoranSamoanScandinavianScotch-IrishScottishSeminoleSenegaleseSerbianShoshoneSierra LeoneanSiouxSlavicSlovakSloveneSomaliSouth AfricanSouth AmericanSouth American IndianSoviet UnionSpaniardSpanishSpanish AmericanSpanish American IndianSri LankanSubsaharan AfricanSudaneseSwedishSwissSyrianTaiwaneseThaiTlingit-HaidaTohono O'OdhamTonganTrinidadian and TobagonianTsimshianTurkishU.S. Virgin IslanderUgandanUkrainianUruguayanUteVenezuelanVietnameseWelshWest IndianYakamaYaquiYugoslavianYumanYup'ikZimbabwean
Immigration
NonimmigrantsImmigrantsAfghanistanAfricaAlbaniaArgentinaArmeniaAsiaAustraliaAustriaBahamasBangladeshBarbadosBelarusBelgiumBelizeBoliviaBosnia and HerzegovinaBrazilBulgariaBurma/MyanmarCabo VerdeCambodiaCameroonCanadaCaribbeanCentral AmericaChileChinaColombiaCongoCosta RicaCroatiaCubaCzechoslovakiaDenmarkDominicaDominican RepublicEastern AfricaEastern AsiaEastern EuropeEcuadorEgyptEl SalvadorEnglandEritreaEthiopiaEuropeFijiFranceGermanyGhanaGreeceGrenadaGuatemalaGuyanaHaitiHondurasHong KongHungaryIndiaIndonesiaIranIraqIrelandIsraelItalyJamaicaJapanJordanKazakhstanKenyaKoreaKuwaitLaosLatin AmericaLatviaLebanonLiberiaLithuaniaMalaysiaMexicoMicronesiaMiddle AfricaMoldovaMoroccoNepalNetherlandsNicaraguaNigeriaNorth AmericaNorth MacedoniaNorthern AfricaNorthern EuropeNorwayOceaniaPakistanPanamaPhilippinesPolandPortugalRomaniaRussiaSaudi ArabiaScotlandSenegalSerbiaSierra LeoneSingaporeSomaliaSouth AfricaSouth AmericaSouth Central AsiaSouth Eastern AsiaSouthern EuropeSpainSri LankaSt. Vincent and the GrenadinesSudanSwedenSwitzerlandSyriaTaiwanThailandTrinidad and TobagoTurkeyUgandaUkraineUruguayUzbekistanVenezuelaVietnamWest IndiesWestern AfricaWestern AsiaWestern EuropeYemenZaireZimbabweAzores
12th Grade, No Diploma
Income
Poverty
Unemployment
Labor Participation
Family Structure
Vehicle Availability
Education Level
Disability

12th Grade, No Diploma Comparison

Immigrants from Peru

Jordanians

Tragic
Exceptional
89.7%
12TH GRADE, NO DIPLOMA
0.5/ 100
METRIC RATING
254th/ 347
METRIC RANK
92.2%
12TH GRADE, NO DIPLOMA
97.2/ 100
METRIC RATING
108th/ 347
METRIC RANK

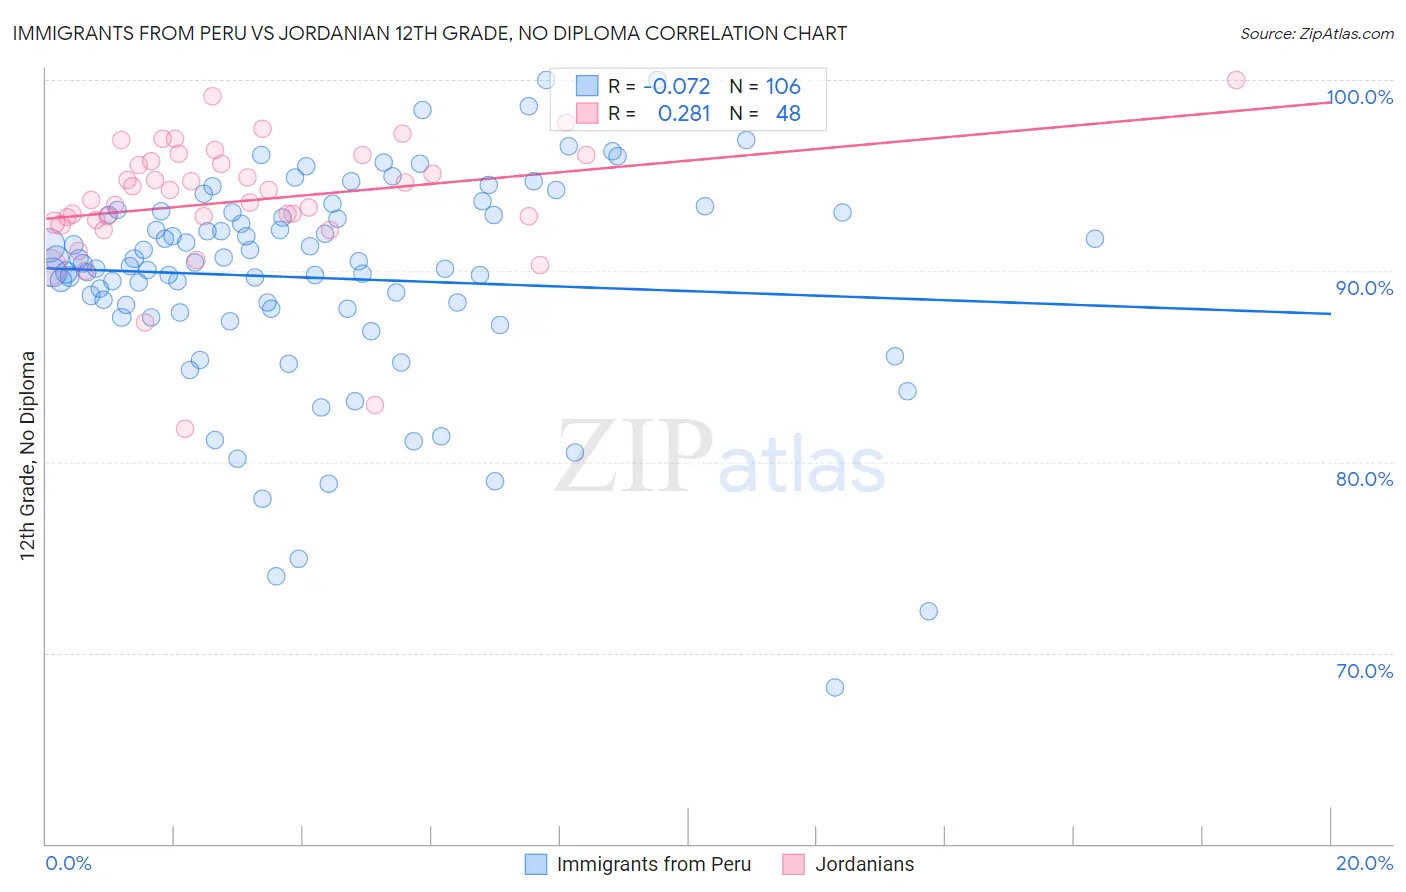
Immigrants from Peru vs Jordanian 12th Grade, No Diploma Correlation Chart

The statistical analysis conducted on geographies consisting of 328,860,880 people shows a slight negative correlation between the proportion of Immigrants from Peru and percentage of population with at least 12th grade (no diploma) education in the United States with a correlation coefficient (R) of -0.072 and weighted average of 89.7%. Similarly, the statistical analysis conducted on geographies consisting of 166,403,553 people shows a weak positive correlation between the proportion of Jordanians and percentage of population with at least 12th grade (no diploma) education in the United States with a correlation coefficient (R) of 0.281 and weighted average of 92.2%, a difference of 2.7%.
Immigrants from Peru vs Jordanian 12th Grade, No Diploma

12th Grade, No Diploma Correlation Summary

MeasurementImmigrants from PeruJordanian
Minimum68.2%81.8%
Maximum100.0%100.0%
Range31.8%18.2%
Mean89.6%93.7%
Median90.4%94.0%
Interquartile 25% (IQ1)88.0%92.6%
Interquartile 75% (IQ3)93.1%95.9%
Interquartile Range (IQR)5.0%3.3%
Standard Deviation (Sample)5.7%3.4%
Standard Deviation (Population)5.6%3.4%

Similar Demographics by 12th Grade, No Diploma

Demographics Similar to Immigrants from Peru by 12th Grade, No Diploma

In terms of 12th grade, no diploma, the demographic groups most similar to Immigrants from Peru are Immigrants from Senegal (89.7%, a difference of 0.010%), Immigrants from Ghana (89.7%, a difference of 0.020%), Jamaican (89.7%, a difference of 0.020%), African (89.6%, a difference of 0.070%), and Choctaw (89.8%, a difference of 0.090%).
DemographicsRating | Rank12th Grade, No Diploma
Immigrants | Nigeria
1.3
/100
|
#247
Tragic
89.9%
Comanche
1.1
/100
|
#248
Tragic
89.9%
Senegalese
1.1
/100
|
#249
Tragic
89.9%
Immigrants | Eritrea
1.0
/100
|
#250
Tragic
89.9%
Spanish Americans
0.9
/100
|
#251
Tragic
89.9%
Bahamians
0.9
/100
|
#252
Tragic
89.9%
Choctaw
0.7
/100
|
#253
Tragic
89.8%
Immigrants | Peru
0.5
/100
|
#254
Tragic
89.7%
Immigrants | Senegal
0.5
/100
|
#255
Tragic
89.7%
Immigrants | Ghana
0.5
/100
|
#256
Tragic
89.7%
Jamaicans
0.5
/100
|
#257
Tragic
89.7%
Africans
0.4
/100
|
#258
Tragic
89.6%
Immigrants | Western Africa
0.4
/100
|
#259
Tragic
89.6%
Immigrants | South Eastern Asia
0.4
/100
|
#260
Tragic
89.6%
Cheyenne
0.4
/100
|
#261
Tragic
89.6%

Demographics Similar to Jordanians by 12th Grade, No Diploma

In terms of 12th grade, no diploma, the demographic groups most similar to Jordanians are Immigrants from Russia (92.2%, a difference of 0.010%), Syrian (92.2%, a difference of 0.010%), Immigrants from Hungary (92.1%, a difference of 0.020%), Palestinian (92.1%, a difference of 0.020%), and Immigrants from Belarus (92.2%, a difference of 0.030%).
DemographicsRating | Rank12th Grade, No Diploma
Swiss
98.1
/100
|
#101
Exceptional
92.3%
Alaskan Athabascans
98.1
/100
|
#102
Exceptional
92.3%
Immigrants | Norway
98.1
/100
|
#103
Exceptional
92.3%
Lebanese
97.6
/100
|
#104
Exceptional
92.2%
Immigrants | Belarus
97.4
/100
|
#105
Exceptional
92.2%
Immigrants | Russia
97.3
/100
|
#106
Exceptional
92.2%
Syrians
97.2
/100
|
#107
Exceptional
92.2%
Jordanians
97.2
/100
|
#108
Exceptional
92.2%
Immigrants | Hungary
97.0
/100
|
#109
Exceptional
92.1%
Palestinians
97.0
/100
|
#110
Exceptional
92.1%
Immigrants | Greece
96.9
/100
|
#111
Exceptional
92.1%
Israelis
96.8
/100
|
#112
Exceptional
92.1%
Immigrants | Zimbabwe
96.5
/100
|
#113
Exceptional
92.1%
Yugoslavians
96.5
/100
|
#114
Exceptional
92.1%
Immigrants | Sri Lanka
96.4
/100
|
#115
Exceptional
92.1%