Immigrants from Peru vs German Russian Nursery School

COMPARE

Immigrants from Peru
Race
Ancestry
AfghanAfricanAlaska NativeAlaskan AthabascanAlbanianAleutAlsatianAmericanApacheArabArapahoArgentineanArmenianAssyrian/Chaldean/SyriacAustralianAustrianBahamianBangladeshiBarbadianBasqueBelgianBelizeanBermudanBhutaneseBlackfeetBolivianBrazilianBritishBritish West IndianBulgarianBurmeseCajunCambodianCanadianCape VerdeanCarpatho RusynCelticCentral AmericanCentral American IndianCherokeeCheyenneChickasawChileanChineseChippewaChoctawColombianColvilleComancheCosta RicanCreeCreekCroatianCrowCubanCypriotCzechCzechoslovakianDanishDelawareDominicanDutchDutch West IndianEastern EuropeanEcuadorianEgyptianEnglishEstonianEthiopianEuropeanFijianFilipinoFinnishFrenchFrench American IndianFrench CanadianGermanGhanaianGreekGuamanian/ChamorroGuatemalanGuyaneseHaitianHmongHonduranHopiHoumaHungarianIcelanderIndian (Asian)IndonesianInupiatIranianIraqiIrishIroquoisIsraeliItalianJamaicanJapaneseJordanianKenyanKiowaKoreanLaotianLatvianLebaneseLiberianLithuanianLumbeeLuxembourgerMacedonianMalaysianMalteseMarshalleseMenomineeMexicanMexican American IndianMongolianMoroccanNative HawaiianNavajoNepaleseNew ZealanderNicaraguanNigerianNorthern EuropeanNorwegianOkinawanOsageOttawaPaiutePakistaniPalestinianPanamanianParaguayanPennsylvania GermanPeruvianPimaPolishPortuguesePotawatomiPuebloPuerto RicanPuget Sound SalishRomanianRussianSalvadoranSamoanScandinavianScotch-IrishScottishSeminoleSenegaleseSerbianShoshoneSierra LeoneanSiouxSlavicSlovakSloveneSomaliSouth AfricanSouth AmericanSouth American IndianSoviet UnionSpaniardSpanishSpanish AmericanSpanish American IndianSri LankanSubsaharan AfricanSudaneseSwedishSwissSyrianTaiwaneseThaiTlingit-HaidaTohono O'OdhamTonganTrinidadian and TobagonianTsimshianTurkishU.S. Virgin IslanderUgandanUkrainianUruguayanUteVenezuelanVietnameseWelshWest IndianYakamaYaquiYugoslavianYumanYup'ikZimbabwean
Immigration
NonimmigrantsImmigrantsAfghanistanAfricaAlbaniaArgentinaArmeniaAsiaAustraliaAustriaBahamasBangladeshBarbadosBelarusBelgiumBelizeBoliviaBosnia and HerzegovinaBrazilBulgariaBurma/MyanmarCabo VerdeCambodiaCameroonCanadaCaribbeanCentral AmericaChileChinaColombiaCongoCosta RicaCroatiaCubaCzechoslovakiaDenmarkDominicaDominican RepublicEastern AfricaEastern AsiaEastern EuropeEcuadorEgyptEl SalvadorEnglandEritreaEthiopiaEuropeFijiFranceGermanyGhanaGreeceGrenadaGuatemalaGuyanaHaitiHondurasHong KongHungaryIndiaIndonesiaIranIraqIrelandIsraelItalyJamaicaJapanJordanKazakhstanKenyaKoreaKuwaitLaosLatin AmericaLatviaLebanonLiberiaLithuaniaMalaysiaMexicoMicronesiaMiddle AfricaMoldovaMoroccoNepalNetherlandsNicaraguaNigeriaNorth AmericaNorth MacedoniaNorthern AfricaNorthern EuropeNorwayOceaniaPakistanPanamaPeruPhilippinesPolandPortugalRomaniaRussiaSaudi ArabiaScotlandSenegalSerbiaSierra LeoneSingaporeSomaliaSouth AfricaSouth AmericaSouth Central AsiaSouth Eastern AsiaSouthern EuropeSpainSri LankaSt. Vincent and the GrenadinesSudanSwedenSwitzerlandSyriaTaiwanThailandTrinidad and TobagoTurkeyUgandaUkraineUruguayUzbekistanVenezuelaVietnamWest IndiesWestern AfricaWestern AsiaWestern EuropeYemenZaireZimbabweAzores
German Russian
Race
Ancestry
AfghanAfricanAlaska NativeAlaskan AthabascanAlbanianAleutAlsatianAmericanApacheArabArapahoArgentineanArmenianAssyrian/Chaldean/SyriacAustralianAustrianBahamianBangladeshiBarbadianBasqueBelgianBelizeanBermudanBhutaneseBlackfeetBolivianBrazilianBritishBritish West IndianBulgarianBurmeseCajunCambodianCanadianCape VerdeanCarpatho RusynCelticCentral AmericanCentral American IndianCherokeeCheyenneChickasawChileanChineseChippewaChoctawColombianColvilleComancheCosta RicanCreeCreekCroatianCrowCubanCypriotCzechCzechoslovakianDanishDelawareDominicanDutchDutch West IndianEastern EuropeanEcuadorianEgyptianEnglishEstonianEthiopianEuropeanFijianFilipinoFinnishFrenchFrench American IndianFrench CanadianGermanGerman RussianGhanaianGreekGuamanian/ChamorroGuatemalanGuyaneseHaitianHmongHonduranHopiHoumaHungarianIcelanderIndian (Asian)IndonesianInupiatIranianIraqiIrishIroquoisIsraeliItalianJamaicanJapaneseJordanianKenyanKiowaKoreanLaotianLatvianLebaneseLiberianLithuanianLumbeeLuxembourgerMacedonianMalaysianMalteseMarshalleseMenomineeMexicanMexican American IndianMongolianMoroccanNative HawaiianNavajoNepaleseNew ZealanderNicaraguanNigerianNorthern EuropeanNorwegianOkinawanOsageOttawaPaiutePakistaniPalestinianPanamanianParaguayanPennsylvania GermanPeruvianPimaPolishPortuguesePotawatomiPuebloPuerto RicanPuget Sound SalishRomanianRussianSalvadoranSamoanScandinavianScotch-IrishScottishSeminoleSenegaleseSerbianShoshoneSierra LeoneanSiouxSlavicSlovakSloveneSomaliSouth AfricanSouth AmericanSouth American IndianSoviet UnionSpaniardSpanishSpanish AmericanSpanish American IndianSri LankanSubsaharan AfricanSudaneseSwedishSwissSyrianTaiwaneseThaiTlingit-HaidaTohono O'OdhamTonganTrinidadian and TobagonianTsimshianTurkishU.S. Virgin IslanderUgandanUkrainianUruguayanUteVenezuelanVietnameseWelshWest IndianYakamaYaquiYugoslavianYumanYup'ikZimbabwean
Immigration
NonimmigrantsImmigrantsAfghanistanAfricaAlbaniaArgentinaArmeniaAsiaAustraliaAustriaBahamasBangladeshBarbadosBelarusBelgiumBelizeBoliviaBosnia and HerzegovinaBrazilBulgariaBurma/MyanmarCabo VerdeCambodiaCameroonCanadaCaribbeanCentral AmericaChileChinaColombiaCongoCosta RicaCroatiaCubaCzechoslovakiaDenmarkDominicaDominican RepublicEastern AfricaEastern AsiaEastern EuropeEcuadorEgyptEl SalvadorEnglandEritreaEthiopiaEuropeFijiFranceGermanyGhanaGreeceGrenadaGuatemalaGuyanaHaitiHondurasHong KongHungaryIndiaIndonesiaIranIraqIrelandIsraelItalyJamaicaJapanJordanKazakhstanKenyaKoreaKuwaitLaosLatin AmericaLatviaLebanonLiberiaLithuaniaMalaysiaMexicoMicronesiaMiddle AfricaMoldovaMoroccoNepalNetherlandsNicaraguaNigeriaNorth AmericaNorth MacedoniaNorthern AfricaNorthern EuropeNorwayOceaniaPakistanPanamaPhilippinesPolandPortugalRomaniaRussiaSaudi ArabiaScotlandSenegalSerbiaSierra LeoneSingaporeSomaliaSouth AfricaSouth AmericaSouth Central AsiaSouth Eastern AsiaSouthern EuropeSpainSri LankaSt. Vincent and the GrenadinesSudanSwedenSwitzerlandSyriaTaiwanThailandTrinidad and TobagoTurkeyUgandaUkraineUruguayUzbekistanVenezuelaVietnamWest IndiesWestern AfricaWestern AsiaWestern EuropeYemenZaireZimbabweAzores
Nursery School
Income
Poverty
Unemployment
Labor Participation
Family Structure
Vehicle Availability
Education Level
Disability

Nursery School Comparison

Immigrants from Peru

German Russians

Tragic
Exceptional
97.5%
NURSERY SCHOOL
0.2/ 100
METRIC RATING
271st/ 347
METRIC RANK
98.2%
NURSERY SCHOOL
97.1/ 100
METRIC RATING
109th/ 347
METRIC RANK

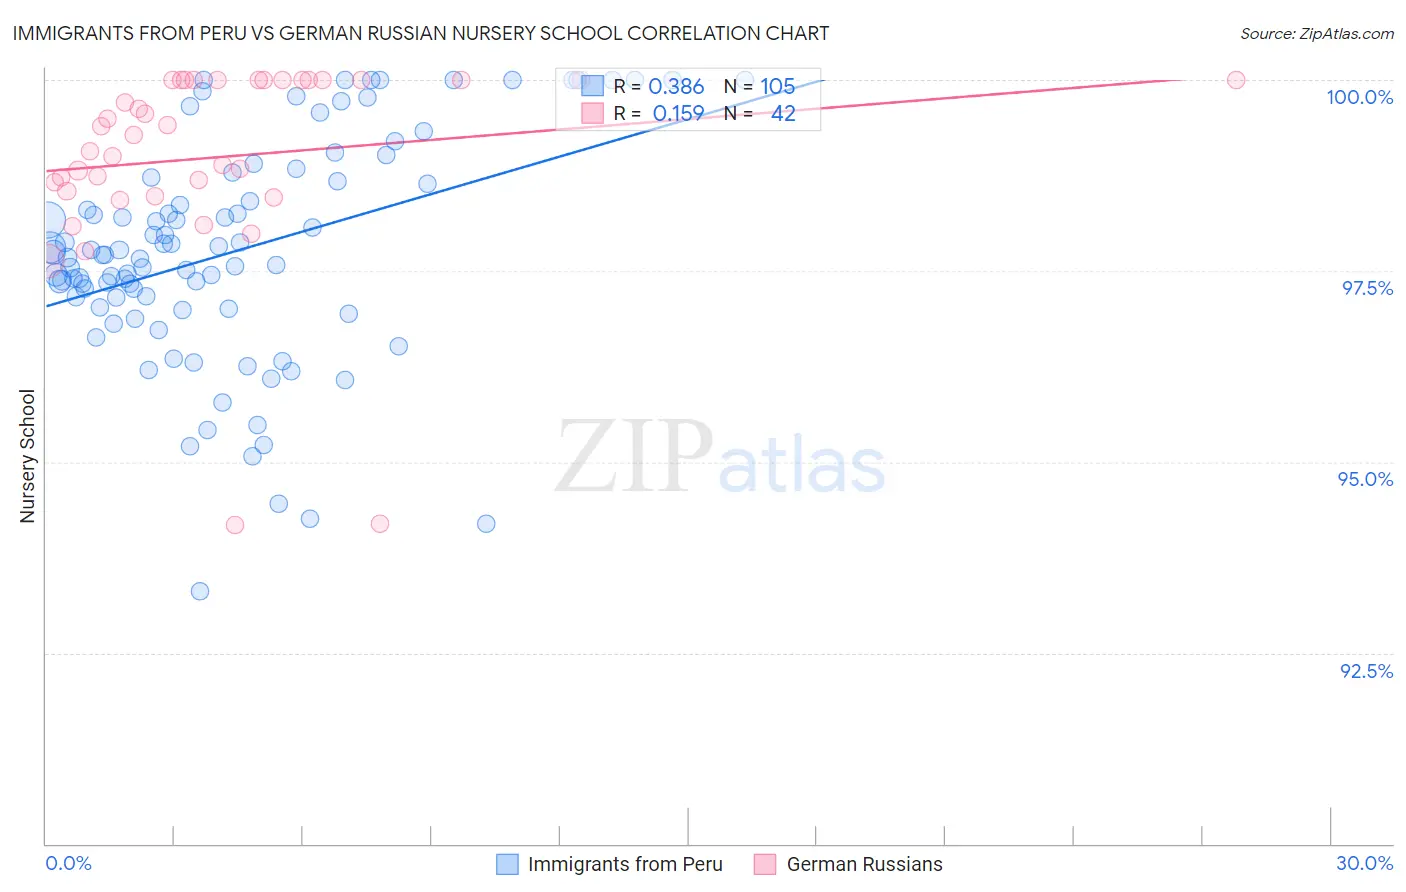
Immigrants from Peru vs German Russian Nursery School Correlation Chart

The statistical analysis conducted on geographies consisting of 328,685,754 people shows a mild positive correlation between the proportion of Immigrants from Peru and percentage of population with at least nursery school education in the United States with a correlation coefficient (R) of 0.386 and weighted average of 97.5%. Similarly, the statistical analysis conducted on geographies consisting of 96,461,520 people shows a poor positive correlation between the proportion of German Russians and percentage of population with at least nursery school education in the United States with a correlation coefficient (R) of 0.159 and weighted average of 98.2%, a difference of 0.75%.
Immigrants from Peru vs German Russian Nursery School

Nursery School Correlation Summary

MeasurementImmigrants from PeruGerman Russian
Minimum93.3%94.2%
Maximum100.0%100.0%
Range6.7%5.8%
Mean97.7%99.0%
Median97.7%99.3%
Interquartile 25% (IQ1)97.0%98.5%
Interquartile 75% (IQ3)98.7%100.0%
Interquartile Range (IQR)1.7%1.5%
Standard Deviation (Sample)1.5%1.3%
Standard Deviation (Population)1.5%1.3%

Similar Demographics by Nursery School

Demographics Similar to Immigrants from Peru by Nursery School

In terms of nursery school, the demographic groups most similar to Immigrants from Peru are Immigrants from Jamaica (97.5%, a difference of 0.020%), Immigrants from Bolivia (97.5%, a difference of 0.020%), West Indian (97.5%, a difference of 0.030%), Immigrants from Liberia (97.5%, a difference of 0.030%), and Immigrants from Sierra Leone (97.6%, a difference of 0.040%).
DemographicsRating | RankNursery School
Taiwanese
0.3
/100
|
#264
Tragic
97.6%
Assyrians/Chaldeans/Syriacs
0.3
/100
|
#265
Tragic
97.6%
Immigrants | Sierra Leone
0.3
/100
|
#266
Tragic
97.6%
Immigrants | Nigeria
0.3
/100
|
#267
Tragic
97.5%
West Indians
0.3
/100
|
#268
Tragic
97.5%
Immigrants | Liberia
0.3
/100
|
#269
Tragic
97.5%
Immigrants | Jamaica
0.2
/100
|
#270
Tragic
97.5%
Immigrants | Peru
0.2
/100
|
#271
Tragic
97.5%
Immigrants | Bolivia
0.1
/100
|
#272
Tragic
97.5%
Immigrants | China
0.1
/100
|
#273
Tragic
97.5%
Immigrants | Cameroon
0.1
/100
|
#274
Tragic
97.5%
Ghanaians
0.1
/100
|
#275
Tragic
97.5%
Immigrants | Philippines
0.1
/100
|
#276
Tragic
97.5%
Immigrants | Western Africa
0.1
/100
|
#277
Tragic
97.4%
Immigrants | Uzbekistan
0.1
/100
|
#278
Tragic
97.4%

Demographics Similar to German Russians by Nursery School

In terms of nursery school, the demographic groups most similar to German Russians are Pima (98.2%, a difference of 0.0%), Bhutanese (98.2%, a difference of 0.010%), Turkish (98.2%, a difference of 0.010%), Immigrants from Switzerland (98.2%, a difference of 0.010%), and Basque (98.2%, a difference of 0.010%).
DemographicsRating | RankNursery School
Immigrants | Ireland
97.7
/100
|
#102
Exceptional
98.3%
Cree
97.7
/100
|
#103
Exceptional
98.3%
Bhutanese
97.4
/100
|
#104
Exceptional
98.2%
Turks
97.4
/100
|
#105
Exceptional
98.2%
Immigrants | Switzerland
97.3
/100
|
#106
Exceptional
98.2%
Basques
97.3
/100
|
#107
Exceptional
98.2%
Pima
97.1
/100
|
#108
Exceptional
98.2%
German Russians
97.1
/100
|
#109
Exceptional
98.2%
Immigrants | Singapore
96.9
/100
|
#110
Exceptional
98.2%
Immigrants | Czechoslovakia
96.8
/100
|
#111
Exceptional
98.2%
Immigrants | Norway
96.6
/100
|
#112
Exceptional
98.2%
Immigrants | Latvia
96.4
/100
|
#113
Exceptional
98.2%
Ute
96.4
/100
|
#114
Exceptional
98.2%
Iranians
96.3
/100
|
#115
Exceptional
98.2%
Spanish
95.8
/100
|
#116
Exceptional
98.2%