Immigrants from Peru vs Cherokee 10th Grade
COMPARE
Immigrants from Peru
Cherokee
10th Grade
10th Grade Comparison
Immigrants from Peru
Cherokee
92.2%
10TH GRADE
0.1/ 100
METRIC RATING
282nd/ 347
METRIC RANK
94.1%
10TH GRADE
84.9/ 100
METRIC RATING
143rd/ 347
METRIC RANK
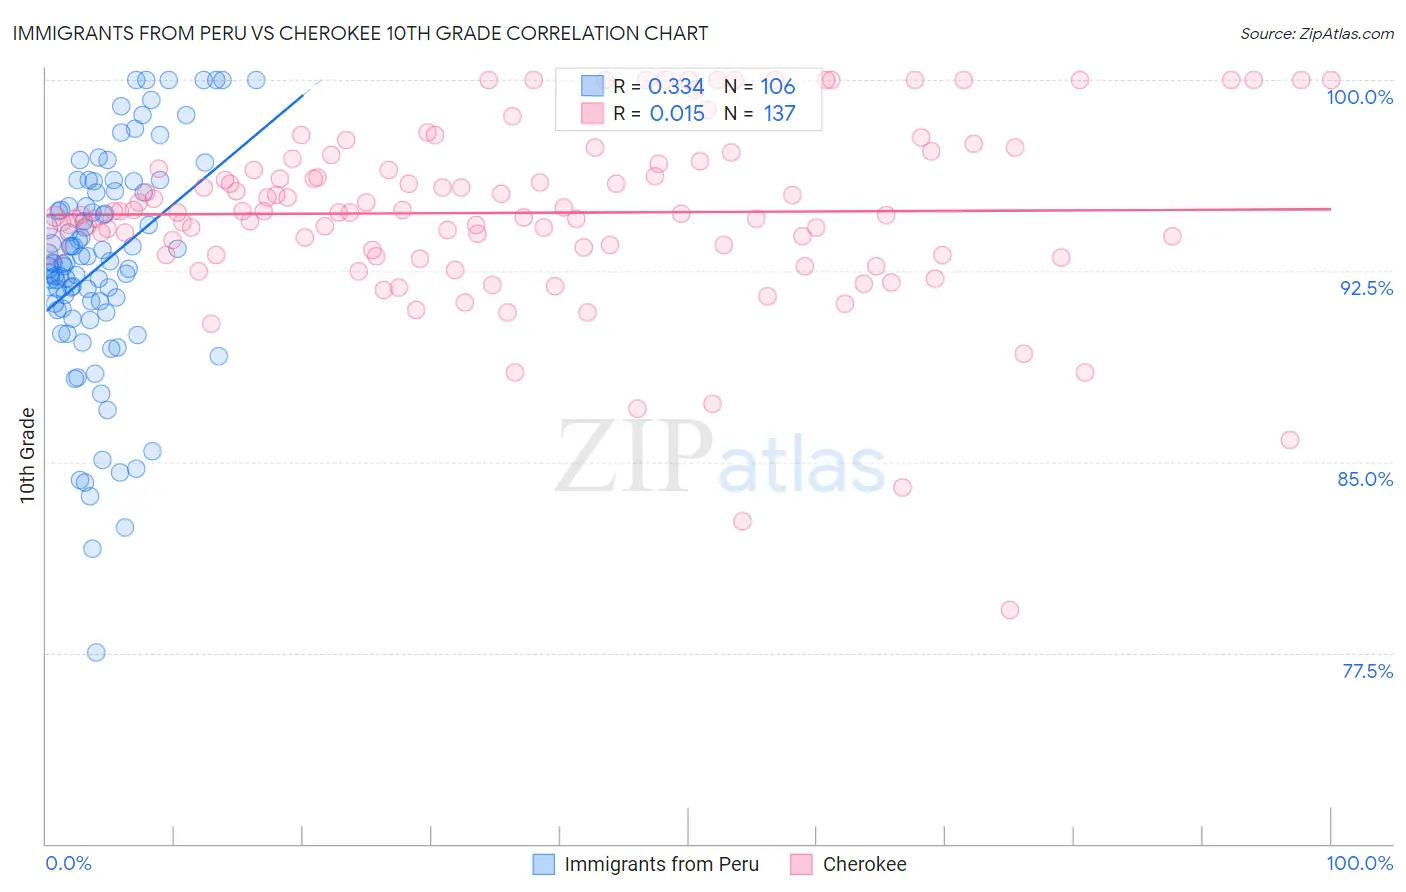
Immigrants from Peru vs Cherokee 10th Grade Correlation Chart
The statistical analysis conducted on geographies consisting of 328,860,880 people shows a mild positive correlation between the proportion of Immigrants from Peru and percentage of population with at least 10th grade education in the United States with a correlation coefficient (R) of 0.334 and weighted average of 92.2%. Similarly, the statistical analysis conducted on geographies consisting of 493,720,058 people shows no correlation between the proportion of Cherokee and percentage of population with at least 10th grade education in the United States with a correlation coefficient (R) of 0.015 and weighted average of 94.1%, a difference of 2.1%.
10th Grade Correlation Summary
| Measurement | Immigrants from Peru | Cherokee |
| Minimum | 77.5% | 79.2% |
| Maximum | 100.0% | 100.0% |
| Range | 22.5% | 20.8% |
| Mean | 92.8% | 94.8% |
| Median | 92.8% | 94.8% |
| Interquartile 25% (IQ1) | 91.0% | 93.2% |
| Interquartile 75% (IQ3) | 95.6% | 96.8% |
| Interquartile Range (IQR) | 4.6% | 3.6% |
| Standard Deviation (Sample) | 4.3% | 3.5% |
| Standard Deviation (Population) | 4.3% | 3.5% |
Similar Demographics by 10th Grade
Demographics Similar to Immigrants from Peru by 10th Grade
In terms of 10th grade, the demographic groups most similar to Immigrants from Peru are Bangladeshi (92.2%, a difference of 0.020%), Malaysian (92.2%, a difference of 0.030%), Barbadian (92.2%, a difference of 0.060%), Native/Alaskan (92.2%, a difference of 0.060%), and Immigrants from St. Vincent and the Grenadines (92.1%, a difference of 0.060%).
| Demographics | Rating | Rank | 10th Grade |
| West Indians | 0.2 /100 | #275 | Tragic 92.4% |
| Immigrants | Trinidad and Tobago | 0.1 /100 | #276 | Tragic 92.3% |
| Navajo | 0.1 /100 | #277 | Tragic 92.3% |
| Barbadians | 0.1 /100 | #278 | Tragic 92.2% |
| Natives/Alaskans | 0.1 /100 | #279 | Tragic 92.2% |
| Malaysians | 0.1 /100 | #280 | Tragic 92.2% |
| Bangladeshis | 0.1 /100 | #281 | Tragic 92.2% |
| Immigrants | Peru | 0.1 /100 | #282 | Tragic 92.2% |
| Immigrants | St. Vincent and the Grenadines | 0.0 /100 | #283 | Tragic 92.1% |
| Immigrants | Barbados | 0.0 /100 | #284 | Tragic 92.1% |
| Immigrants | South Eastern Asia | 0.0 /100 | #285 | Tragic 92.1% |
| Yuman | 0.0 /100 | #286 | Tragic 92.0% |
| Pennsylvania Germans | 0.0 /100 | #287 | Tragic 91.9% |
| Immigrants | Laos | 0.0 /100 | #288 | Tragic 91.9% |
| Sri Lankans | 0.0 /100 | #289 | Tragic 91.8% |
Demographics Similar to Cherokee by 10th Grade
In terms of 10th grade, the demographic groups most similar to Cherokee are Immigrants from Kazakhstan (94.1%, a difference of 0.0%), Nonimmigrants (94.1%, a difference of 0.020%), Hmong (94.1%, a difference of 0.030%), Albanian (94.1%, a difference of 0.030%), and Chickasaw (94.1%, a difference of 0.040%).
| Demographics | Rating | Rank | 10th Grade |
| Shoshone | 90.8 /100 | #136 | Exceptional 94.2% |
| Arapaho | 90.5 /100 | #137 | Exceptional 94.2% |
| Immigrants | Sri Lanka | 89.9 /100 | #138 | Excellent 94.2% |
| Immigrants | Bosnia and Herzegovina | 89.4 /100 | #139 | Excellent 94.2% |
| Immigrants | Jordan | 87.6 /100 | #140 | Excellent 94.1% |
| Hmong | 86.6 /100 | #141 | Excellent 94.1% |
| Albanians | 86.5 /100 | #142 | Excellent 94.1% |
| Cherokee | 84.9 /100 | #143 | Excellent 94.1% |
| Immigrants | Kazakhstan | 84.9 /100 | #144 | Excellent 94.1% |
| Immigrants | Nonimmigrants | 83.8 /100 | #145 | Excellent 94.1% |
| Chickasaw | 82.6 /100 | #146 | Excellent 94.1% |
| Immigrants | Ukraine | 81.5 /100 | #147 | Excellent 94.0% |
| Arabs | 80.9 /100 | #148 | Excellent 94.0% |
| Ugandans | 80.7 /100 | #149 | Excellent 94.0% |
| Egyptians | 79.6 /100 | #150 | Good 94.0% |