Immigrants from Panama vs Immigrants from Western Europe 7th Grade

COMPARE

Immigrants from Panama
Race
Ancestry
AfghanAfricanAlaska NativeAlaskan AthabascanAlbanianAleutAlsatianAmericanApacheArabArapahoArgentineanArmenianAssyrian/Chaldean/SyriacAustralianAustrianBahamianBangladeshiBarbadianBasqueBelgianBelizeanBermudanBhutaneseBlackfeetBolivianBrazilianBritishBritish West IndianBulgarianBurmeseCajunCambodianCanadianCape VerdeanCarpatho RusynCelticCentral AmericanCentral American IndianCherokeeCheyenneChickasawChileanChineseChippewaChoctawColombianColvilleComancheCosta RicanCreeCreekCroatianCrowCubanCypriotCzechCzechoslovakianDanishDelawareDominicanDutchDutch West IndianEastern EuropeanEcuadorianEgyptianEnglishEstonianEthiopianEuropeanFijianFilipinoFinnishFrenchFrench American IndianFrench CanadianGermanGerman RussianGhanaianGreekGuamanian/ChamorroGuatemalanGuyaneseHaitianHmongHonduranHopiHoumaHungarianIcelanderIndian (Asian)IndonesianInupiatIranianIraqiIrishIroquoisIsraeliItalianJamaicanJapaneseJordanianKenyanKiowaKoreanLaotianLatvianLebaneseLiberianLithuanianLumbeeLuxembourgerMacedonianMalaysianMalteseMarshalleseMenomineeMexicanMexican American IndianMongolianMoroccanNative HawaiianNavajoNepaleseNew ZealanderNicaraguanNigerianNorthern EuropeanNorwegianOkinawanOsageOttawaPaiutePakistaniPalestinianPanamanianParaguayanPennsylvania GermanPeruvianPimaPolishPortuguesePotawatomiPuebloPuerto RicanPuget Sound SalishRomanianRussianSalvadoranSamoanScandinavianScotch-IrishScottishSeminoleSenegaleseSerbianShoshoneSierra LeoneanSiouxSlavicSlovakSloveneSomaliSouth AfricanSouth AmericanSouth American IndianSoviet UnionSpaniardSpanishSpanish AmericanSpanish American IndianSri LankanSubsaharan AfricanSudaneseSwedishSwissSyrianTaiwaneseThaiTlingit-HaidaTohono O'OdhamTonganTrinidadian and TobagonianTsimshianTurkishU.S. Virgin IslanderUgandanUkrainianUruguayanUteVenezuelanVietnameseWelshWest IndianYakamaYaquiYugoslavianYumanYup'ikZimbabwean
Immigration
NonimmigrantsImmigrantsAfghanistanAfricaAlbaniaArgentinaArmeniaAsiaAustraliaAustriaBahamasBangladeshBarbadosBelarusBelgiumBelizeBoliviaBosnia and HerzegovinaBrazilBulgariaBurma/MyanmarCabo VerdeCambodiaCameroonCanadaCaribbeanCentral AmericaChileChinaColombiaCongoCosta RicaCroatiaCubaCzechoslovakiaDenmarkDominicaDominican RepublicEastern AfricaEastern AsiaEastern EuropeEcuadorEgyptEl SalvadorEnglandEritreaEthiopiaEuropeFijiFranceGermanyGhanaGreeceGrenadaGuatemalaGuyanaHaitiHondurasHong KongHungaryIndiaIndonesiaIranIraqIrelandIsraelItalyJamaicaJapanJordanKazakhstanKenyaKoreaKuwaitLaosLatin AmericaLatviaLebanonLiberiaLithuaniaMalaysiaMexicoMicronesiaMiddle AfricaMoldovaMoroccoNepalNetherlandsNicaraguaNigeriaNorth AmericaNorth MacedoniaNorthern AfricaNorthern EuropeNorwayOceaniaPakistanPanamaPeruPhilippinesPolandPortugalRomaniaRussiaSaudi ArabiaScotlandSenegalSerbiaSierra LeoneSingaporeSomaliaSouth AfricaSouth AmericaSouth Central AsiaSouth Eastern AsiaSouthern EuropeSpainSri LankaSt. Vincent and the GrenadinesSudanSwedenSwitzerlandSyriaTaiwanThailandTrinidad and TobagoTurkeyUgandaUkraineUruguayUzbekistanVenezuelaVietnamWest IndiesWestern AfricaWestern AsiaYemenZaireZimbabweAzores
Immigrants from Western Europe
Race
Ancestry
AfghanAfricanAlaska NativeAlaskan AthabascanAlbanianAleutAlsatianAmericanApacheArabArapahoArgentineanArmenianAssyrian/Chaldean/SyriacAustralianAustrianBahamianBangladeshiBarbadianBasqueBelgianBelizeanBermudanBhutaneseBlackfeetBolivianBrazilianBritishBritish West IndianBulgarianBurmeseCajunCambodianCanadianCape VerdeanCarpatho RusynCelticCentral AmericanCentral American IndianCherokeeCheyenneChickasawChileanChineseChippewaChoctawColombianColvilleComancheCosta RicanCreeCreekCroatianCrowCubanCypriotCzechCzechoslovakianDanishDelawareDominicanDutchDutch West IndianEastern EuropeanEcuadorianEgyptianEnglishEstonianEthiopianEuropeanFijianFilipinoFinnishFrenchFrench American IndianFrench CanadianGermanGerman RussianGhanaianGreekGuamanian/ChamorroGuatemalanGuyaneseHaitianHmongHonduranHopiHoumaHungarianIcelanderIndian (Asian)IndonesianInupiatIranianIraqiIrishIroquoisIsraeliItalianJamaicanJapaneseJordanianKenyanKiowaKoreanLaotianLatvianLebaneseLiberianLithuanianLumbeeLuxembourgerMacedonianMalaysianMalteseMarshalleseMenomineeMexicanMexican American IndianMongolianMoroccanNative HawaiianNavajoNepaleseNew ZealanderNicaraguanNigerianNorthern EuropeanNorwegianOkinawanOsageOttawaPaiutePakistaniPalestinianPanamanianParaguayanPennsylvania GermanPeruvianPimaPolishPortuguesePotawatomiPuebloPuerto RicanPuget Sound SalishRomanianRussianSalvadoranSamoanScandinavianScotch-IrishScottishSeminoleSenegaleseSerbianShoshoneSierra LeoneanSiouxSlavicSlovakSloveneSomaliSouth AfricanSouth AmericanSouth American IndianSoviet UnionSpaniardSpanishSpanish AmericanSpanish American IndianSri LankanSubsaharan AfricanSudaneseSwedishSwissSyrianTaiwaneseThaiTlingit-HaidaTohono O'OdhamTonganTrinidadian and TobagonianTsimshianTurkishU.S. Virgin IslanderUgandanUkrainianUruguayanUteVenezuelanVietnameseWelshWest IndianYakamaYaquiYugoslavianYumanYup'ikZimbabwean
Immigration
NonimmigrantsImmigrantsAfghanistanAfricaAlbaniaArgentinaArmeniaAsiaAustraliaAustriaBahamasBangladeshBarbadosBelarusBelgiumBelizeBoliviaBosnia and HerzegovinaBrazilBulgariaBurma/MyanmarCabo VerdeCambodiaCameroonCanadaCaribbeanCentral AmericaChileChinaColombiaCongoCosta RicaCroatiaCubaCzechoslovakiaDenmarkDominicaDominican RepublicEastern AfricaEastern AsiaEastern EuropeEcuadorEgyptEl SalvadorEnglandEritreaEthiopiaEuropeFijiFranceGermanyGhanaGreeceGrenadaGuatemalaGuyanaHaitiHondurasHong KongHungaryIndiaIndonesiaIranIraqIrelandIsraelItalyJamaicaJapanJordanKazakhstanKenyaKoreaKuwaitLaosLatin AmericaLatviaLebanonLiberiaLithuaniaMalaysiaMexicoMicronesiaMiddle AfricaMoldovaMoroccoNepalNetherlandsNicaraguaNigeriaNorth AmericaNorth MacedoniaNorthern AfricaNorthern EuropeNorwayOceaniaPakistanPeruPhilippinesPolandPortugalRomaniaRussiaSaudi ArabiaScotlandSenegalSerbiaSierra LeoneSingaporeSomaliaSouth AfricaSouth AmericaSouth Central AsiaSouth Eastern AsiaSouthern EuropeSpainSri LankaSt. Vincent and the GrenadinesSudanSwedenSwitzerlandSyriaTaiwanThailandTrinidad and TobagoTurkeyUgandaUkraineUruguayUzbekistanVenezuelaVietnamWest IndiesWestern AfricaWestern AsiaWestern EuropeYemenZaireZimbabweAzores
7th Grade
Income
Poverty
Unemployment
Labor Participation
Family Structure
Vehicle Availability
Education Level
Disability

7th Grade Comparison

Immigrants from Panama

Immigrants from Western Europe

Tragic
Exceptional
95.6%
7TH GRADE
4.9/ 100
METRIC RATING
229th/ 347
METRIC RANK
96.7%
7TH GRADE
98.9/ 100
METRIC RATING
92nd/ 347
METRIC RANK

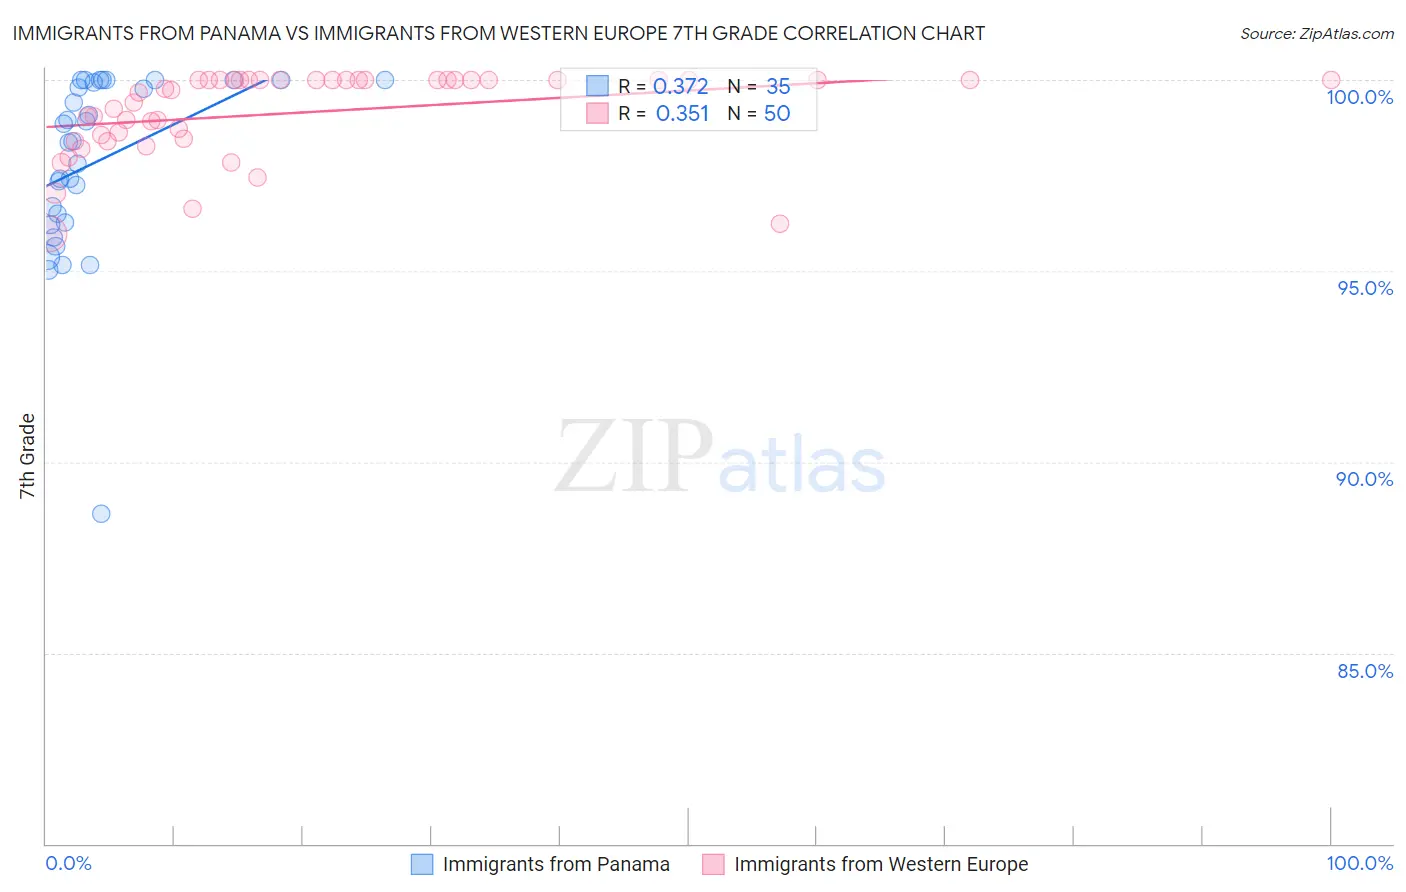
Immigrants from Panama vs Immigrants from Western Europe 7th Grade Correlation Chart

The statistical analysis conducted on geographies consisting of 221,182,871 people shows a mild positive correlation between the proportion of Immigrants from Panama and percentage of population with at least 7th grade education in the United States with a correlation coefficient (R) of 0.372 and weighted average of 95.6%. Similarly, the statistical analysis conducted on geographies consisting of 494,080,430 people shows a mild positive correlation between the proportion of Immigrants from Western Europe and percentage of population with at least 7th grade education in the United States with a correlation coefficient (R) of 0.351 and weighted average of 96.7%, a difference of 1.1%.
Immigrants from Panama vs Immigrants from Western Europe 7th Grade

7th Grade Correlation Summary

MeasurementImmigrants from PanamaImmigrants from Western Europe
Minimum88.7%96.0%
Maximum100.0%100.0%
Range11.3%4.0%
Mean97.9%99.1%
Median98.4%99.8%
Interquartile 25% (IQ1)96.3%98.5%
Interquartile 75% (IQ3)100.0%100.0%
Interquartile Range (IQR)3.7%1.5%
Standard Deviation (Sample)2.4%1.1%
Standard Deviation (Population)2.3%1.1%

Similar Demographics by 7th Grade

Demographics Similar to Immigrants from Panama by 7th Grade

In terms of 7th grade, the demographic groups most similar to Immigrants from Panama are Immigrants from Western Asia (95.6%, a difference of 0.010%), Immigrants from Eastern Africa (95.6%, a difference of 0.010%), Native/Alaskan (95.6%, a difference of 0.020%), Immigrants from Eastern Asia (95.6%, a difference of 0.030%), and Senegalese (95.6%, a difference of 0.030%).
DemographicsRating | Rank7th Grade
Laotians
6.8
/100
|
#222
Tragic
95.7%
Immigrants | Syria
6.7
/100
|
#223
Tragic
95.7%
Immigrants | Oceania
6.7
/100
|
#224
Tragic
95.7%
Immigrants | Malaysia
6.2
/100
|
#225
Tragic
95.6%
Immigrants | Eastern Asia
5.8
/100
|
#226
Tragic
95.6%
Immigrants | Western Asia
5.4
/100
|
#227
Tragic
95.6%
Immigrants | Eastern Africa
5.1
/100
|
#228
Tragic
95.6%
Immigrants | Panama
4.9
/100
|
#229
Tragic
95.6%
Natives/Alaskans
4.2
/100
|
#230
Tragic
95.6%
Senegalese
4.0
/100
|
#231
Tragic
95.6%
Costa Ricans
3.3
/100
|
#232
Tragic
95.5%
Immigrants | Indonesia
3.3
/100
|
#233
Tragic
95.5%
Nigerians
3.0
/100
|
#234
Tragic
95.5%
Immigrants | Africa
2.7
/100
|
#235
Tragic
95.5%
Asians
2.6
/100
|
#236
Tragic
95.5%

Demographics Similar to Immigrants from Western Europe by 7th Grade

In terms of 7th grade, the demographic groups most similar to Immigrants from Western Europe are Immigrants from South Africa (96.7%, a difference of 0.0%), Osage (96.7%, a difference of 0.0%), Potawatomi (96.7%, a difference of 0.0%), Immigrants from Belgium (96.7%, a difference of 0.010%), and Puget Sound Salish (96.7%, a difference of 0.010%).
DemographicsRating | Rank7th Grade
Kiowa
99.1
/100
|
#85
Exceptional
96.7%
Turks
99.1
/100
|
#86
Exceptional
96.7%
Immigrants | Belgium
99.0
/100
|
#87
Exceptional
96.7%
Puget Sound Salish
99.0
/100
|
#88
Exceptional
96.7%
Cree
99.0
/100
|
#89
Exceptional
96.7%
Immigrants | South Africa
98.9
/100
|
#90
Exceptional
96.7%
Osage
98.9
/100
|
#91
Exceptional
96.7%
Immigrants | Western Europe
98.9
/100
|
#92
Exceptional
96.7%
Potawatomi
98.9
/100
|
#93
Exceptional
96.7%
Lebanese
98.8
/100
|
#94
Exceptional
96.7%
Immigrants | Australia
98.8
/100
|
#95
Exceptional
96.7%
Immigrants | Denmark
98.7
/100
|
#96
Exceptional
96.7%
Immigrants | Germany
98.7
/100
|
#97
Exceptional
96.7%
Immigrants | Sweden
98.7
/100
|
#98
Exceptional
96.7%
Menominee
98.7
/100
|
#99
Exceptional
96.7%