Immigrants from Panama vs British Master's Degree

COMPARE

Immigrants from Panama
Race
Ancestry
AfghanAfricanAlaska NativeAlaskan AthabascanAlbanianAleutAlsatianAmericanApacheArabArapahoArgentineanArmenianAssyrian/Chaldean/SyriacAustralianAustrianBahamianBangladeshiBarbadianBasqueBelgianBelizeanBermudanBhutaneseBlackfeetBolivianBrazilianBritish West IndianBulgarianBurmeseCajunCambodianCanadianCape VerdeanCarpatho RusynCelticCentral AmericanCentral American IndianCherokeeCheyenneChickasawChileanChineseChippewaChoctawColombianColvilleComancheCosta RicanCreeCreekCroatianCrowCubanCypriotCzechCzechoslovakianDanishDelawareDominicanDutchDutch West IndianEastern EuropeanEcuadorianEgyptianEnglishEstonianEthiopianEuropeanFijianFilipinoFinnishFrenchFrench American IndianFrench CanadianGermanGerman RussianGhanaianGreekGuamanian/ChamorroGuatemalanGuyaneseHaitianHmongHonduranHopiHoumaHungarianIcelanderIndian (Asian)IndonesianInupiatIranianIraqiIrishIroquoisIsraeliItalianJamaicanJapaneseJordanianKenyanKiowaKoreanLaotianLatvianLebaneseLiberianLithuanianLumbeeLuxembourgerMacedonianMalaysianMalteseMarshalleseMenomineeMexicanMexican American IndianMongolianMoroccanNative HawaiianNavajoNepaleseNew ZealanderNicaraguanNigerianNorthern EuropeanNorwegianOkinawanOsageOttawaPaiutePakistaniPalestinianPanamanianParaguayanPennsylvania GermanPeruvianPimaPolishPortuguesePotawatomiPuebloPuerto RicanPuget Sound SalishRomanianRussianSalvadoranSamoanScandinavianScotch-IrishScottishSeminoleSenegaleseSerbianShoshoneSierra LeoneanSiouxSlavicSlovakSloveneSomaliSouth AfricanSouth AmericanSouth American IndianSoviet UnionSpaniardSpanishSpanish AmericanSpanish American IndianSri LankanSubsaharan AfricanSudaneseSwedishSwissSyrianTaiwaneseThaiTlingit-HaidaTohono O'OdhamTonganTrinidadian and TobagonianTsimshianTurkishU.S. Virgin IslanderUgandanUkrainianUruguayanUteVenezuelanVietnameseWelshWest IndianYakamaYaquiYugoslavianYumanYup'ikZimbabwean
Immigration
NonimmigrantsImmigrantsAfghanistanAfricaAlbaniaArgentinaArmeniaAsiaAustraliaAustriaBahamasBangladeshBarbadosBelarusBelgiumBelizeBoliviaBosnia and HerzegovinaBrazilBulgariaBurma/MyanmarCabo VerdeCambodiaCameroonCanadaCaribbeanCentral AmericaChileChinaColombiaCongoCosta RicaCroatiaCubaCzechoslovakiaDenmarkDominicaDominican RepublicEastern AfricaEastern AsiaEastern EuropeEcuadorEgyptEl SalvadorEnglandEritreaEthiopiaEuropeFijiFranceGermanyGhanaGreeceGrenadaGuatemalaGuyanaHaitiHondurasHong KongHungaryIndiaIndonesiaIranIraqIrelandIsraelItalyJamaicaJapanJordanKazakhstanKenyaKoreaKuwaitLaosLatin AmericaLatviaLebanonLiberiaLithuaniaMalaysiaMexicoMicronesiaMiddle AfricaMoldovaMoroccoNepalNetherlandsNicaraguaNigeriaNorth AmericaNorth MacedoniaNorthern AfricaNorthern EuropeNorwayOceaniaPakistanPanamaPeruPhilippinesPolandPortugalRomaniaRussiaSaudi ArabiaScotlandSenegalSerbiaSierra LeoneSingaporeSomaliaSouth AfricaSouth AmericaSouth Central AsiaSouth Eastern AsiaSouthern EuropeSpainSri LankaSt. Vincent and the GrenadinesSudanSwedenSwitzerlandSyriaTaiwanThailandTrinidad and TobagoTurkeyUgandaUkraineUruguayUzbekistanVenezuelaVietnamWest IndiesWestern AfricaWestern AsiaWestern EuropeYemenZaireZimbabweAzores
British
Race
Ancestry
AfghanAfricanAlaska NativeAlaskan AthabascanAlbanianAleutAlsatianAmericanApacheArabArapahoArgentineanArmenianAssyrian/Chaldean/SyriacAustralianAustrianBahamianBangladeshiBarbadianBasqueBelgianBelizeanBermudanBhutaneseBlackfeetBolivianBrazilianBritishBritish West IndianBulgarianBurmeseCajunCambodianCanadianCape VerdeanCarpatho RusynCelticCentral AmericanCentral American IndianCherokeeCheyenneChickasawChileanChineseChippewaChoctawColombianColvilleComancheCosta RicanCreeCreekCroatianCrowCubanCypriotCzechCzechoslovakianDanishDelawareDominicanDutchDutch West IndianEastern EuropeanEcuadorianEgyptianEnglishEstonianEthiopianEuropeanFijianFilipinoFinnishFrenchFrench American IndianFrench CanadianGermanGerman RussianGhanaianGreekGuamanian/ChamorroGuatemalanGuyaneseHaitianHmongHonduranHopiHoumaHungarianIcelanderIndian (Asian)IndonesianInupiatIranianIraqiIrishIroquoisIsraeliItalianJamaicanJapaneseJordanianKenyanKiowaKoreanLaotianLatvianLebaneseLiberianLithuanianLumbeeLuxembourgerMacedonianMalaysianMalteseMarshalleseMenomineeMexicanMexican American IndianMongolianMoroccanNative HawaiianNavajoNepaleseNew ZealanderNicaraguanNigerianNorthern EuropeanNorwegianOkinawanOsageOttawaPaiutePakistaniPalestinianPanamanianParaguayanPennsylvania GermanPeruvianPimaPolishPortuguesePotawatomiPuebloPuerto RicanPuget Sound SalishRomanianRussianSalvadoranSamoanScandinavianScotch-IrishScottishSeminoleSenegaleseSerbianShoshoneSierra LeoneanSiouxSlavicSlovakSloveneSomaliSouth AfricanSouth AmericanSouth American IndianSoviet UnionSpaniardSpanishSpanish AmericanSpanish American IndianSri LankanSubsaharan AfricanSudaneseSwedishSwissSyrianTaiwaneseThaiTlingit-HaidaTohono O'OdhamTonganTrinidadian and TobagonianTsimshianTurkishU.S. Virgin IslanderUgandanUkrainianUruguayanUteVenezuelanVietnameseWelshWest IndianYakamaYaquiYugoslavianYumanYup'ikZimbabwean
Immigration
NonimmigrantsImmigrantsAfghanistanAfricaAlbaniaArgentinaArmeniaAsiaAustraliaAustriaBahamasBangladeshBarbadosBelarusBelgiumBelizeBoliviaBosnia and HerzegovinaBrazilBulgariaBurma/MyanmarCabo VerdeCambodiaCameroonCanadaCaribbeanCentral AmericaChileChinaColombiaCongoCosta RicaCroatiaCubaCzechoslovakiaDenmarkDominicaDominican RepublicEastern AfricaEastern AsiaEastern EuropeEcuadorEgyptEl SalvadorEnglandEritreaEthiopiaEuropeFijiFranceGermanyGhanaGreeceGrenadaGuatemalaGuyanaHaitiHondurasHong KongHungaryIndiaIndonesiaIranIraqIrelandIsraelItalyJamaicaJapanJordanKazakhstanKenyaKoreaKuwaitLaosLatin AmericaLatviaLebanonLiberiaLithuaniaMalaysiaMexicoMicronesiaMiddle AfricaMoldovaMoroccoNepalNetherlandsNicaraguaNigeriaNorth AmericaNorth MacedoniaNorthern AfricaNorthern EuropeNorwayOceaniaPakistanPeruPhilippinesPolandPortugalRomaniaRussiaSaudi ArabiaScotlandSenegalSerbiaSierra LeoneSingaporeSomaliaSouth AfricaSouth AmericaSouth Central AsiaSouth Eastern AsiaSouthern EuropeSpainSri LankaSt. Vincent and the GrenadinesSudanSwedenSwitzerlandSyriaTaiwanThailandTrinidad and TobagoTurkeyUgandaUkraineUruguayUzbekistanVenezuelaVietnamWest IndiesWestern AfricaWestern AsiaWestern EuropeYemenZaireZimbabweAzores
Master's Degree
Income
Poverty
Unemployment
Labor Participation
Family Structure
Vehicle Availability
Education Level
Disability

Master's Degree Comparison

Immigrants from Panama

British

Fair
Exceptional
14.3%
MASTER'S DEGREE
20.0/ 100
METRIC RATING
209th/ 347
METRIC RANK
16.4%
MASTER'S DEGREE
95.6/ 100
METRIC RATING
122nd/ 347
METRIC RANK

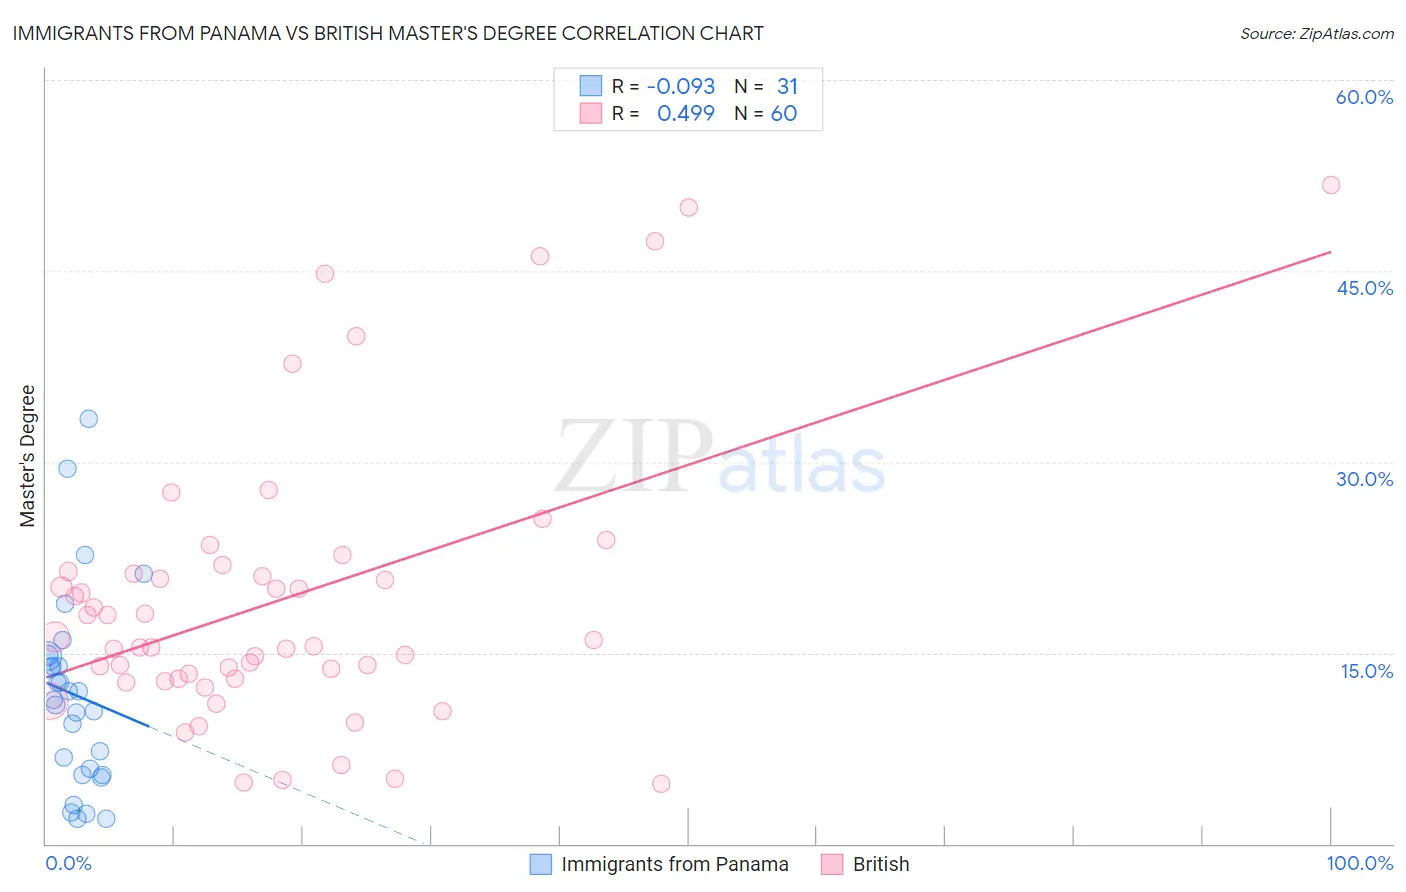
Immigrants from Panama vs British Master's Degree Correlation Chart

The statistical analysis conducted on geographies consisting of 221,161,051 people shows a slight negative correlation between the proportion of Immigrants from Panama and percentage of population with at least master's degree education in the United States with a correlation coefficient (R) of -0.093 and weighted average of 14.3%. Similarly, the statistical analysis conducted on geographies consisting of 531,094,529 people shows a moderate positive correlation between the proportion of British and percentage of population with at least master's degree education in the United States with a correlation coefficient (R) of 0.499 and weighted average of 16.4%, a difference of 14.9%.
Immigrants from Panama vs British Master's Degree

Master's Degree Correlation Summary

MeasurementImmigrants from PanamaBritish
Minimum1.9%4.8%
Maximum33.4%51.7%
Range31.4%47.0%
Mean11.7%19.2%
Median11.3%15.7%
Interquartile 25% (IQ1)5.4%13.0%
Interquartile 75% (IQ3)14.7%21.3%
Interquartile Range (IQR)9.4%8.4%
Standard Deviation (Sample)7.6%11.1%
Standard Deviation (Population)7.5%11.0%

Similar Demographics by Master's Degree

Demographics Similar to Immigrants from Panama by Master's Degree

In terms of master's degree, the demographic groups most similar to Immigrants from Panama are Immigrants from Barbados (14.3%, a difference of 0.090%), Subsaharan African (14.2%, a difference of 0.13%), Immigrants from Bosnia and Herzegovina (14.3%, a difference of 0.39%), Somali (14.2%, a difference of 0.44%), and Spanish (14.2%, a difference of 0.49%).
DemographicsRating | RankMaster's Degree
Immigrants | Western Africa
24.9
/100
|
#202
Fair
14.4%
Yugoslavians
24.3
/100
|
#203
Fair
14.4%
French
23.7
/100
|
#204
Fair
14.4%
Trinidadians and Tobagonians
23.5
/100
|
#205
Fair
14.4%
Scandinavians
23.3
/100
|
#206
Fair
14.4%
Immigrants | Bosnia and Herzegovina
22.0
/100
|
#207
Fair
14.3%
Immigrants | Barbados
20.5
/100
|
#208
Fair
14.3%
Immigrants | Panama
20.0
/100
|
#209
Fair
14.3%
Sub-Saharan Africans
19.4
/100
|
#210
Poor
14.2%
Somalis
18.0
/100
|
#211
Poor
14.2%
Spanish
17.8
/100
|
#212
Poor
14.2%
Immigrants | Thailand
17.0
/100
|
#213
Poor
14.2%
Finns
16.9
/100
|
#214
Poor
14.2%
Immigrants | Vietnam
16.1
/100
|
#215
Poor
14.1%
Immigrants | Somalia
15.8
/100
|
#216
Poor
14.1%

Demographics Similar to British by Master's Degree

In terms of master's degree, the demographic groups most similar to British are Croatian (16.4%, a difference of 0.010%), Immigrants from Eritrea (16.4%, a difference of 0.080%), Italian (16.4%, a difference of 0.16%), Immigrants from Eastern Africa (16.3%, a difference of 0.27%), and Afghan (16.5%, a difference of 0.43%).
DemographicsRating | RankMaster's Degree
Immigrants | Uganda
97.3
/100
|
#115
Exceptional
16.6%
Immigrants | Southern Europe
97.2
/100
|
#116
Exceptional
16.6%
Immigrants | Moldova
97.2
/100
|
#117
Exceptional
16.6%
Brazilians
96.8
/100
|
#118
Exceptional
16.5%
Jordanians
96.5
/100
|
#119
Exceptional
16.5%
Lebanese
96.4
/100
|
#120
Exceptional
16.5%
Afghans
96.2
/100
|
#121
Exceptional
16.5%
British
95.6
/100
|
#122
Exceptional
16.4%
Croatians
95.6
/100
|
#123
Exceptional
16.4%
Immigrants | Eritrea
95.5
/100
|
#124
Exceptional
16.4%
Italians
95.4
/100
|
#125
Exceptional
16.4%
Immigrants | Eastern Africa
95.2
/100
|
#126
Exceptional
16.3%
Palestinians
94.8
/100
|
#127
Exceptional
16.3%
Immigrants | Sierra Leone
94.7
/100
|
#128
Exceptional
16.3%
Immigrants | Syria
93.3
/100
|
#129
Exceptional
16.2%