Immigrants from Pakistan vs Sri Lankan Master's Degree

COMPARE

Immigrants from Pakistan
Race
Ancestry
AfghanAfricanAlaska NativeAlaskan AthabascanAlbanianAleutAlsatianAmericanApacheArabArapahoArgentineanArmenianAssyrian/Chaldean/SyriacAustralianAustrianBahamianBangladeshiBarbadianBasqueBelgianBelizeanBermudanBhutaneseBlackfeetBolivianBrazilianBritishBritish West IndianBulgarianBurmeseCajunCambodianCanadianCape VerdeanCarpatho RusynCelticCentral AmericanCentral American IndianCherokeeCheyenneChickasawChileanChineseChippewaChoctawColombianColvilleComancheCosta RicanCreeCreekCroatianCrowCubanCypriotCzechCzechoslovakianDanishDelawareDominicanDutchDutch West IndianEastern EuropeanEcuadorianEgyptianEnglishEstonianEthiopianEuropeanFijianFilipinoFinnishFrenchFrench American IndianFrench CanadianGermanGerman RussianGhanaianGreekGuamanian/ChamorroGuatemalanGuyaneseHaitianHmongHonduranHopiHoumaHungarianIcelanderIndian (Asian)IndonesianInupiatIranianIraqiIrishIroquoisIsraeliItalianJamaicanJapaneseJordanianKenyanKiowaKoreanLaotianLatvianLebaneseLiberianLithuanianLumbeeLuxembourgerMacedonianMalaysianMalteseMarshalleseMenomineeMexicanMexican American IndianMongolianMoroccanNative HawaiianNavajoNepaleseNew ZealanderNicaraguanNigerianNorthern EuropeanNorwegianOkinawanOsageOttawaPaiutePakistaniPalestinianPanamanianParaguayanPennsylvania GermanPeruvianPimaPolishPortuguesePotawatomiPuebloPuerto RicanPuget Sound SalishRomanianRussianSalvadoranSamoanScandinavianScotch-IrishScottishSeminoleSenegaleseSerbianShoshoneSierra LeoneanSiouxSlavicSlovakSloveneSomaliSouth AfricanSouth AmericanSouth American IndianSoviet UnionSpaniardSpanishSpanish AmericanSpanish American IndianSubsaharan AfricanSudaneseSwedishSwissSyrianTaiwaneseThaiTlingit-HaidaTohono O'OdhamTonganTrinidadian and TobagonianTsimshianTurkishU.S. Virgin IslanderUgandanUkrainianUruguayanUteVenezuelanVietnameseWelshWest IndianYakamaYaquiYugoslavianYumanYup'ikZimbabwean
Immigration
NonimmigrantsImmigrantsAfghanistanAfricaAlbaniaArgentinaArmeniaAsiaAustraliaAustriaBahamasBangladeshBarbadosBelarusBelgiumBelizeBoliviaBosnia and HerzegovinaBrazilBulgariaBurma/MyanmarCabo VerdeCambodiaCameroonCanadaCaribbeanCentral AmericaChileChinaColombiaCongoCosta RicaCroatiaCubaCzechoslovakiaDenmarkDominicaDominican RepublicEastern AfricaEastern AsiaEastern EuropeEcuadorEgyptEl SalvadorEnglandEritreaEthiopiaEuropeFijiFranceGermanyGhanaGreeceGrenadaGuatemalaGuyanaHaitiHondurasHong KongHungaryIndiaIndonesiaIranIraqIrelandIsraelItalyJamaicaJapanJordanKazakhstanKenyaKoreaKuwaitLaosLatin AmericaLatviaLebanonLiberiaLithuaniaMalaysiaMexicoMicronesiaMiddle AfricaMoldovaMoroccoNepalNetherlandsNicaraguaNigeriaNorth AmericaNorth MacedoniaNorthern AfricaNorthern EuropeNorwayOceaniaPakistanPanamaPeruPhilippinesPolandPortugalRomaniaRussiaSaudi ArabiaScotlandSenegalSerbiaSierra LeoneSingaporeSomaliaSouth AfricaSouth AmericaSouth Central AsiaSouth Eastern AsiaSouthern EuropeSpainSri LankaSt. Vincent and the GrenadinesSudanSwedenSwitzerlandSyriaTaiwanThailandTrinidad and TobagoTurkeyUgandaUkraineUruguayUzbekistanVenezuelaVietnamWest IndiesWestern AfricaWestern AsiaWestern EuropeYemenZaireZimbabweAzores
Sri Lankan
Race
Ancestry
AfghanAfricanAlaska NativeAlaskan AthabascanAlbanianAleutAlsatianAmericanApacheArabArapahoArgentineanArmenianAssyrian/Chaldean/SyriacAustralianAustrianBahamianBangladeshiBarbadianBasqueBelgianBelizeanBermudanBhutaneseBlackfeetBolivianBrazilianBritishBritish West IndianBulgarianBurmeseCajunCambodianCanadianCape VerdeanCarpatho RusynCelticCentral AmericanCentral American IndianCherokeeCheyenneChickasawChileanChineseChippewaChoctawColombianColvilleComancheCosta RicanCreeCreekCroatianCrowCubanCypriotCzechCzechoslovakianDanishDelawareDominicanDutchDutch West IndianEastern EuropeanEcuadorianEgyptianEnglishEstonianEthiopianEuropeanFijianFilipinoFinnishFrenchFrench American IndianFrench CanadianGermanGerman RussianGhanaianGreekGuamanian/ChamorroGuatemalanGuyaneseHaitianHmongHonduranHopiHoumaHungarianIcelanderIndian (Asian)IndonesianInupiatIranianIraqiIrishIroquoisIsraeliItalianJamaicanJapaneseJordanianKenyanKiowaKoreanLaotianLatvianLebaneseLiberianLithuanianLumbeeLuxembourgerMacedonianMalaysianMalteseMarshalleseMenomineeMexicanMexican American IndianMongolianMoroccanNative HawaiianNavajoNepaleseNew ZealanderNicaraguanNigerianNorthern EuropeanNorwegianOkinawanOsageOttawaPaiutePakistaniPalestinianPanamanianParaguayanPennsylvania GermanPeruvianPimaPolishPortuguesePotawatomiPuebloPuerto RicanPuget Sound SalishRomanianRussianSalvadoranSamoanScandinavianScotch-IrishScottishSeminoleSenegaleseSerbianShoshoneSierra LeoneanSiouxSlavicSlovakSloveneSomaliSouth AfricanSouth AmericanSouth American IndianSoviet UnionSpaniardSpanishSpanish AmericanSpanish American IndianSri LankanSubsaharan AfricanSudaneseSwedishSwissSyrianTaiwaneseThaiTlingit-HaidaTohono O'OdhamTonganTrinidadian and TobagonianTsimshianTurkishU.S. Virgin IslanderUgandanUkrainianUruguayanUteVenezuelanVietnameseWelshWest IndianYakamaYaquiYugoslavianYumanYup'ikZimbabwean
Immigration
NonimmigrantsImmigrantsAfghanistanAfricaAlbaniaArgentinaArmeniaAsiaAustraliaAustriaBahamasBangladeshBarbadosBelarusBelgiumBelizeBoliviaBosnia and HerzegovinaBrazilBulgariaBurma/MyanmarCabo VerdeCambodiaCameroonCanadaCaribbeanCentral AmericaChileChinaColombiaCongoCosta RicaCroatiaCubaCzechoslovakiaDenmarkDominicaDominican RepublicEastern AfricaEastern AsiaEastern EuropeEcuadorEgyptEl SalvadorEnglandEritreaEthiopiaEuropeFijiFranceGermanyGhanaGreeceGrenadaGuatemalaGuyanaHaitiHondurasHong KongHungaryIndiaIndonesiaIranIraqIrelandIsraelItalyJamaicaJapanJordanKazakhstanKenyaKoreaKuwaitLaosLatin AmericaLatviaLebanonLiberiaLithuaniaMalaysiaMexicoMicronesiaMiddle AfricaMoldovaMoroccoNepalNetherlandsNicaraguaNigeriaNorth AmericaNorth MacedoniaNorthern AfricaNorthern EuropeNorwayOceaniaPanamaPeruPhilippinesPolandPortugalRomaniaRussiaSaudi ArabiaScotlandSenegalSerbiaSierra LeoneSingaporeSomaliaSouth AfricaSouth AmericaSouth Central AsiaSouth Eastern AsiaSouthern EuropeSpainSri LankaSt. Vincent and the GrenadinesSudanSwedenSwitzerlandSyriaTaiwanThailandTrinidad and TobagoTurkeyUgandaUkraineUruguayUzbekistanVenezuelaVietnamWest IndiesWestern AfricaWestern AsiaWestern EuropeYemenZaireZimbabweAzores
Master's Degree
Income
Poverty
Unemployment
Labor Participation
Family Structure
Vehicle Availability
Education Level
Disability

Master's Degree Comparison

Immigrants from Pakistan

Sri Lankans

Exceptional
Fair
17.8%
MASTER'S DEGREE
99.7/ 100
METRIC RATING
71st/ 347
METRIC RANK
14.7%
MASTER'S DEGREE
39.6/ 100
METRIC RATING
183rd/ 347
METRIC RANK

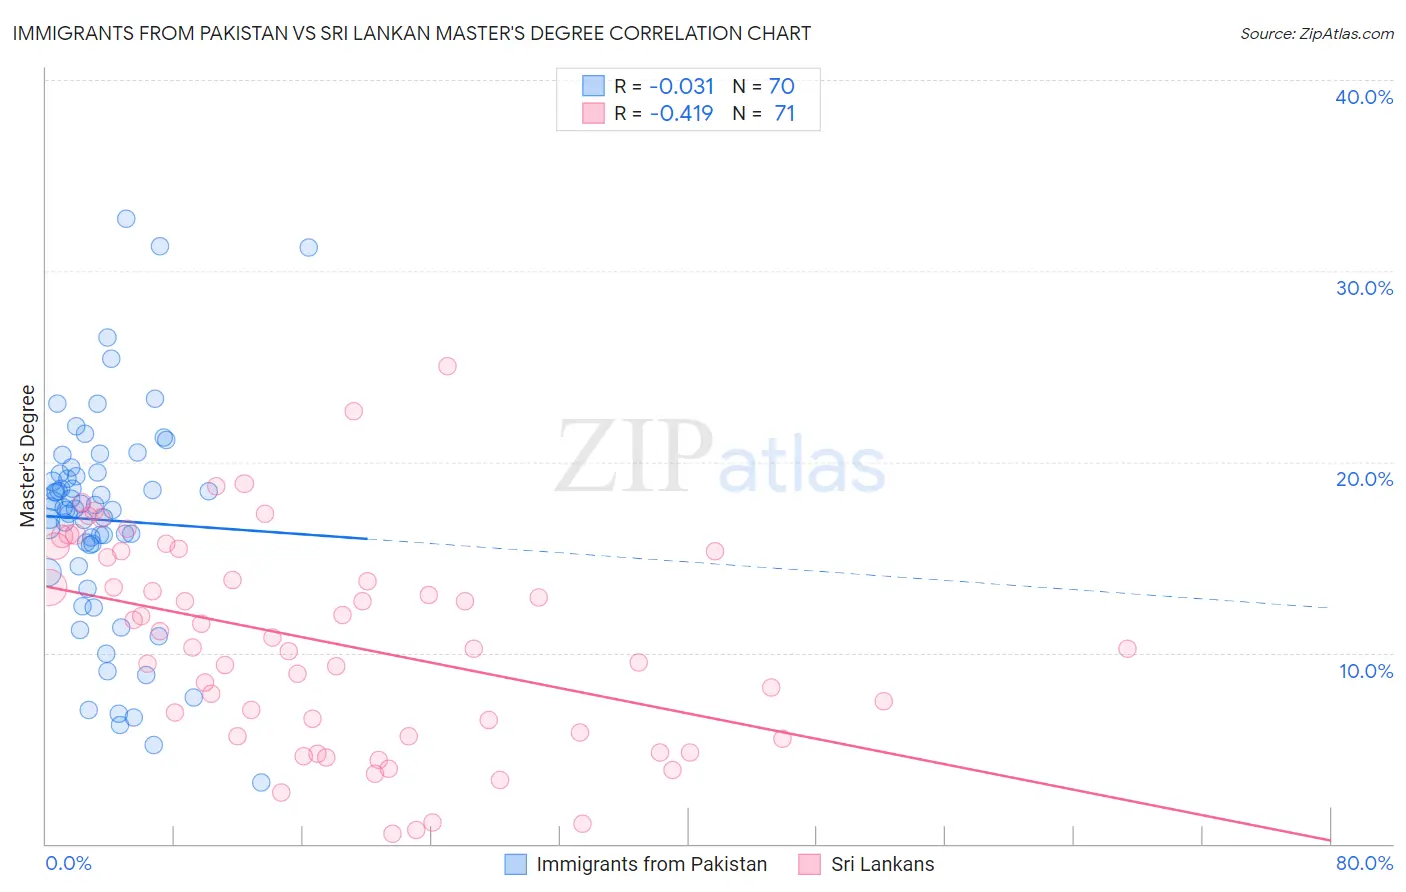
Immigrants from Pakistan vs Sri Lankan Master's Degree Correlation Chart

The statistical analysis conducted on geographies consisting of 283,872,372 people shows no correlation between the proportion of Immigrants from Pakistan and percentage of population with at least master's degree education in the United States with a correlation coefficient (R) of -0.031 and weighted average of 17.8%. Similarly, the statistical analysis conducted on geographies consisting of 440,331,802 people shows a moderate negative correlation between the proportion of Sri Lankans and percentage of population with at least master's degree education in the United States with a correlation coefficient (R) of -0.419 and weighted average of 14.7%, a difference of 20.7%.
Immigrants from Pakistan vs Sri Lankan Master's Degree

Master's Degree Correlation Summary

MeasurementImmigrants from PakistanSri Lankan
Minimum3.2%0.51%
Maximum32.7%25.0%
Range29.5%24.5%
Mean17.0%10.5%
Median17.6%10.3%
Interquartile 25% (IQ1)14.5%5.7%
Interquartile 75% (IQ3)19.4%15.3%
Interquartile Range (IQR)4.9%9.7%
Standard Deviation (Sample)5.8%5.5%
Standard Deviation (Population)5.7%5.4%

Similar Demographics by Master's Degree

Demographics Similar to Immigrants from Pakistan by Master's Degree

In terms of master's degree, the demographic groups most similar to Immigrants from Pakistan are Lithuanian (17.7%, a difference of 0.17%), Immigrants from Western Europe (17.8%, a difference of 0.28%), Zimbabwean (17.7%, a difference of 0.28%), Immigrants from Uzbekistan (17.9%, a difference of 0.50%), and Immigrants from Romania (17.7%, a difference of 0.59%).
DemographicsRating | RankMaster's Degree
South Africans
99.9
/100
|
#64
Exceptional
18.1%
Immigrants | Kazakhstan
99.8
/100
|
#65
Exceptional
18.0%
Ethiopians
99.8
/100
|
#66
Exceptional
18.0%
Immigrants | Argentina
99.8
/100
|
#67
Exceptional
18.0%
Immigrants | Ethiopia
99.8
/100
|
#68
Exceptional
17.9%
Immigrants | Uzbekistan
99.8
/100
|
#69
Exceptional
17.9%
Immigrants | Western Europe
99.8
/100
|
#70
Exceptional
17.8%
Immigrants | Pakistan
99.7
/100
|
#71
Exceptional
17.8%
Lithuanians
99.7
/100
|
#72
Exceptional
17.7%
Zimbabweans
99.7
/100
|
#73
Exceptional
17.7%
Immigrants | Romania
99.7
/100
|
#74
Exceptional
17.7%
Egyptians
99.6
/100
|
#75
Exceptional
17.6%
Immigrants | Indonesia
99.6
/100
|
#76
Exceptional
17.6%
Immigrants | Eastern Europe
99.6
/100
|
#77
Exceptional
17.6%
Immigrants | Hungary
99.6
/100
|
#78
Exceptional
17.5%

Demographics Similar to Sri Lankans by Master's Degree

In terms of master's degree, the demographic groups most similar to Sri Lankans are Immigrants from Zaire (14.7%, a difference of 0.020%), Czech (14.7%, a difference of 0.10%), Barbadian (14.7%, a difference of 0.18%), Swiss (14.7%, a difference of 0.20%), and Celtic (14.8%, a difference of 0.22%).
DemographicsRating | RankMaster's Degree
Nigerians
48.6
/100
|
#176
Average
14.9%
Immigrants | Colombia
48.3
/100
|
#177
Average
14.9%
English
45.0
/100
|
#178
Average
14.8%
Immigrants | Iraq
41.3
/100
|
#179
Average
14.8%
Celtics
41.3
/100
|
#180
Average
14.8%
Swiss
41.1
/100
|
#181
Average
14.7%
Czechs
40.4
/100
|
#182
Average
14.7%
Sri Lankans
39.6
/100
|
#183
Fair
14.7%
Immigrants | Zaire
39.5
/100
|
#184
Fair
14.7%
Barbadians
38.3
/100
|
#185
Fair
14.7%
Immigrants | Oceania
37.1
/100
|
#186
Fair
14.7%
Basques
36.5
/100
|
#187
Fair
14.7%
Immigrants | Costa Rica
36.2
/100
|
#188
Fair
14.7%
Immigrants | Immigrants
36.0
/100
|
#189
Fair
14.6%
Spaniards
35.8
/100
|
#190
Fair
14.6%